Turbomachinery and Full Spectrum
An important measurement made with the Vibration analyzers is the one of turbomachinery starts and stops and full spectrum.
This article belongs to a series, which constitutes the support material for the course on vibration analysis in turbomachinery. Links to the other articles can be found on here.
Vibration analysis is one of the most powerful tools for diagnosing the mechanical condition of turbomachinery — steam and gas turbines, centrifugal compressors, large pumps and other critical rotating equipment. For decades, the frequency spectrum obtained by Fast Fourier Transform (FFT) from a single vibration signal has been the basis of diagnosis. However, this traditional approach, although useful, hides crucial information: O direction of vein precession within bearing or bearing clearance.
It is precisely to fill this gap that the concept of full spectrum (full spectrum), a technique that combines the signals from two proximity transducers mounted perpendicular to each other (typically at 90°, X-Y configuration) to reconstruct the complete orbital motion of the axis and reveal information that the conventional spectrum, by itself, cannot provide.
the conventional spectrum
the conventional spectrum, or half spectrum, displays the amplitude of vibration on the vertical axis versus the frequency of vibration on the horizontal axis. It is constructed using the time base waveform sampled from a single transducer.
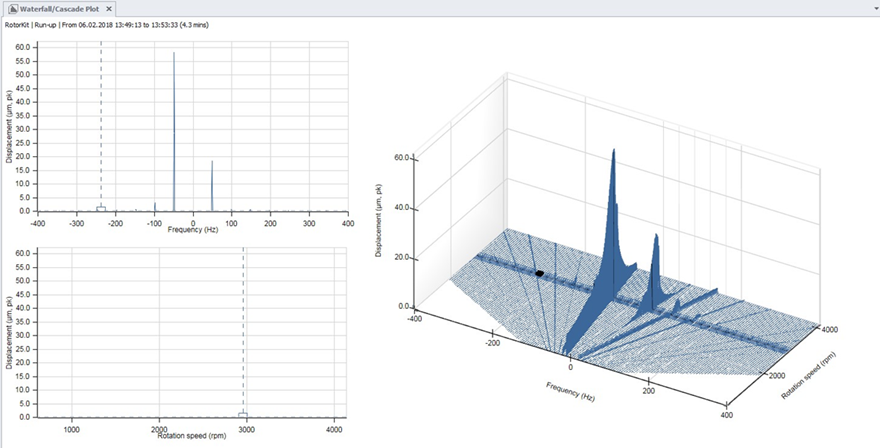
Turbomachinery and Full Spectrum – Figure 1 – Conventional spectrum and full spectrum
The limitations of traditional spectrum
On a machine equipped with non-contact proximity sensors (induced current probes), It is common to install two radial transducers 90° out of phase on the same measurement plane. Traditionally, each signal is processed independently: an X channel spectrum and a Y channel spectrum are obtained, each showing amplitude versus frequency.
The problem is that the conventional spectrum is calculated from a real signal (unidimensional) e, by mathematical construction, is always symmetrical — the energy associated with a given frequency appears identically whether the motion is considered “positive” he wants “negative” on this axis. A real spectrum, by itself, does not distinguish between direct precession (forward) and retrograde precession (reverse ou backward) of the shaft inside the bearing. This distinction is fundamental, because many failure mechanisms in turbomachinery manifest themselves precisely through the direction in which the shaft orbits.
The full spectrum concept
Full spectrum solves this limitation by treating the X-Y signal pair not as two separate quantities, but as the real and imaginary components of a single complex signal:
z(t) = x(t) + j y(t)
By applying the Fourier Transform to this complex signal, a spectrum is obtained that is no longer symmetrical. Instead, for each frequency of interest, the energy is divided between a positive frequency component (associated with direct precession, in the same direction of rotation of the shaft) and a negative frequency component (associated with retrograde precession, in the opposite direction to rotation).
In practice, the full spectrum graph is presented with the frequency axis extending to negative and positive values, and the height of each spectral line on each side indicates the amplitude of the orbit associated with that precession direction at that frequency. The difference between forward and backward amplitudes, in turn, It also allows you to infer the shape of the orbit (circular, elliptical) no need to directly observe the orbit graph in the time domain.

Figure 1 — The two proximity transducers, mounted in quadrature (90°) in the same plane transverse to the shaft, provide the signals x(t) Hey(t) which are combined into the complex signal z(t) = x(t) + j y(t).

Figure 2 — While the traditional spectrum (single channel, real signal) only presents amplitude per positive frequency, the full spectrum separates the energy of each frequency into a forward component (right) e backward (left), revealing the meaning of precession.
Turbomachinery and Full Spectrum – yours training
Full spectrum uses waveforms from an orthogonal pair of vibration transducers (usually relative to the shaft). The full spectrum shows the frequency and direction of precession on the horizontal axis.
- The precession frequencies direct are displayed to the right of the origin
- The precession frequencies reverse are displayed to the left of the origin.
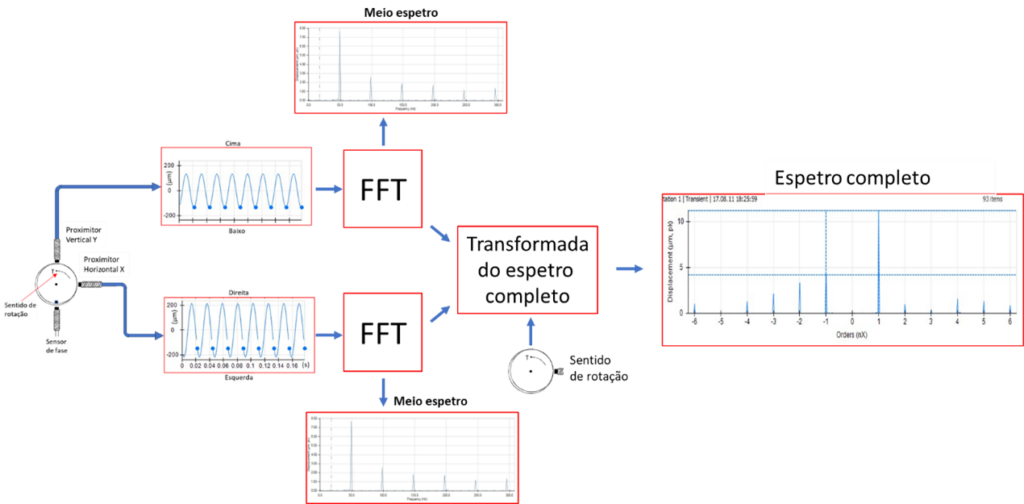
Turbomachinery and Full Spectrum – Figure 2 – The formation of the Full Spectrum
The full spectrum is the spectrum of an orbit, and the pairs of forward and reverse frequency components represent orbit components (filtered orbits). The ratio of amplitudes of pairs of full spectrum components provides information about the ellipticity and precession direction of the components, important features for troubleshooting. However, there is no information about the orientation of the orbit.
Practical interpretation: forward versus backward
Direct precession (forward): the center of the axis orbits in the same direction as the rotation of the axis itself. It's the behavior “normal” expected on most healthy machines, typically associated with residual imbalance (1x rotation).
retrograde precession (backward ou reverse): the center of the axis orbits in the opposite direction to the rotation. This behavior is anomalous in most situations and is associated with specific failure mechanisms..
By representing the full spectrum, Each failure component can be characterized not only by its frequency and amplitude, but also by its predominant sense of precession — a third dimension of diagnosis that the simple spectrum does not offer.

Figure 3 — In direct precession (forward), the center of the axis orbits in the same direction as the rotation ω; in retrograde precession (backward), the orbit occurs in the opposite direction.
Relationship between the orbit and the Full Spectrum.
In the following video you can see the relationship between the orbit and the full spectrum.
Applications in turbomachinery diagnosis
1. Instabilities in hydrodynamic bearings (oil whirl e oil whip)
Perhaps the most valuable application of full spectrum is in detecting oil film instabilities in plain bearings. (journal bearings), common in large turbomachinery. O oil whirl typically manifests itself between 0,40 e 0,48 times the speed, com strong direct precession, and the oil whip occurs when this component “grass” at the first natural frequency of the rotor. The full spectrum allows us to unequivocally confirm that this is subsynchronous direct precession, distinguishing these conditions from other causes of subsynchronous vibration that could produce similar amplitudes in the traditional spectrum, but with different precession sense signatures.

Figure 4 — Illustrative example of full spectrum with dominant forward peak at ≈0.47x rotational speed, characteristic signature of oil whirl. The residual and low backward amplitude confirms a nearly circular orbit with clearly direct precession.
2. Rotor-stator friction (rub)
Situations of friction between the rotor and stationary components (labyrinths, seals, picks) often generate subsynchronous components or combinations of harmonics with retrograde precession, especially in cases of severe rub and maintained. The presence of significant energy on the backward side of the full spectrum, coinciding with thermal or bearing temperature symptoms, is a strong indicator of mechanical contact.
3. Cracks in the shaft (cracked shaft)
Split shafts can generate components at 2x rotational speed with precession characteristics that change with load and machine speed. Analysis of the precession direction of this component along starting and stopping ramps, visualized via full-spectrum waterfall charts (full spectrum waterfall), helps differentiate a crack from other causes of vibration at 2x, as severe misalignment.
4. Misalignment and mechanical play
Severe misalignments and excessive play in bearings or supports also produce characteristic signatures across the full spectrum., often with strongly elliptical orbits (large difference between the forward and backward components in the fundamental frequency), helping to differentiate these problems from a simple imbalance, which tends to produce more circular orbits.
Summary of toFull Spectrum applications
In the table below you can see how the symptoms of different anomalies appear in the full spectrum.
Table 1 – Symptoms of various full-spectrum anomalies
| type of failure | Frequency | direction of rotation | comments | ||
| direct | reverse | ||||
| Imbalance | 1X | + | In the presence of anisotropic support stiffness | The direct component is fundamental for the balance. The inverse component can be reduced by reducing the anterior component.. | |
| radial unidirectional force | 1X | + | + | With increasing radial load, the direct components at 1X and 2X decrease, the inverse components at 1X and 2X increase; the ellipticity of the 1X and 2X orbits increases. | |
| 2X | + | + | |||
| partial friction | 1X | + | + | The 1X and 2X components behave similarly to the unidirectional radial load: increase in the amplitude of the inverse component and decrease in the amplitude of the direct component with increasing severity of friction. One thing to look out for is the rotation of the main axis of the filtered orbit. The 1/2X components, 1/3X, … appear if the rotation speed is greater than, correspondingly, 2, 3, … times the friction-modified natural frequency of the rotor. These subsynchronous frequencies have forward and backward components.. Corresponding filtered orbits are too elliptical, and the inverse components may be predominant. | |
| 2X | + | + | |||
| 1/2X, 1/3X, …. | + | + | |||
| complete annular friction | forced answer | 1X | + | – | Depending on dry friction between impeller and seal, the susceptibility of the sealant, damping and imbalance, the system may display a forced response, predominantly 1X forward, or a self-excited response, predominantly inverse. |
| self excited response | Natural frequency of the rotor-sealant coupler system | – | + | ||
| Oil whirl | λX λ=0.3 to 0.6 | + | – | Predominantly direct orbit with internal loops (a combination of tourbillon and 1X components). Reflects across the spectrum as a direct subsynchronous component. | |
| Oil whip | Excitation of the natural frequency of the rotor | + | + | Predominantly direct orbit with internal loops (a combination of whip and 1X components). Normally, some inverse 1X and subsynchronous components are present due to anisotropy of bearing pedestal stiffness. | |
Advantages over the traditional approach
- Precession direction detection, information that does not exist in the simple real spectrum.
- More robust differential diagnosis, allowing to distinguish phenomena that produce similar amplitude spectra but distinct physical mechanisms (for example, oil whirl versus rub subsíncrono).
- Characterization of the orbital shape directly in the frequency domain, no need for manual inspection of point-by-point orbits.
- Compatibility with trending techniques, such as waterfalls and Bode/polar maps, allowing to monitor the evolution of dynamic behavior throughout starts, downtime and machine life.
Practical implementation requirements
To correctly apply full spectrum analysis, is necessary:
- Install two radial proximity transducers, ideally 90° out of phase in the same measuring plane transverse to the shaft.
- Ensure correct identification of the sign convention and direction of rotation of the machine, so that the forward/backward interpretation is consistent.
- Use acquisition systems and software capable of processing both channels as a correlated pair (complex signal), and not just independently.
- Ensure strict temporal synchronization between the two channels, since any spurious delay introduces error in the orbit reconstruction.
Conclusion
The full spectrum represents a natural and significant evolution compared to the traditional frequency spectrum in the analysis of turbomachinery vibrations. By exploiting the joint information of two orthogonal transducers and reconstructing the signal as a complex quantity, This technique reveals the direction of precession of the axis — a diagnostic dimension absent in classical spectral analysis — allowing phenomena such as oil film instabilities to be identified with greater confidence., rotor-stator rubbing, shaft cracks and severe misalignments. On critical machines equipped with hydrodynamic bearings, its use is now considered good practice and an indispensable tool in the arsenal of the vibrational diagnostic engineer.