Why turbomachinery starts and stops
In this article, an introduction is made to the reason for carrying out tests of turbomachinery starts and stops common vibration analyzer.
This article belongs to a series, which constitutes the support material for the course on vibration analysis in turbomachinery. Links to the other articles can be found on here.
Why turbomachinery starts and stops – when they take place
The follow-up intervention for turbomachinery starts and stops normally takes place:
- Before a review
- After a review
- Diagnosis of abnormal behavior
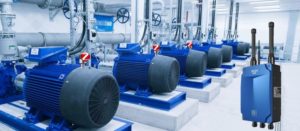
Usually this service is implemented on large machines, high speed, with oil film bearings and proximitors.

Why turbomachinery starts and stops – Figure 1
Why turbomachinery starts and stops – The information provided by the transient state
The vibration of a machine in a transient state, is used to provide much more information than just steady state data. Transient vibration data is defined as vibration data obtained when the machine starts or stops. (that is, big changes in speed).
The transient vibration of a machine provides an amount of information that is not available from steady-state data.. Among these are:
- The ability to compare the amplitude of vibration, phase, shaft position, etc., at speeds above and below critical spindle speeds;
- The best signature of the general natural frequencies of the rotor, which are usually a result of the complex relationship between the rotor and supports (bearings, fencing, etc.) and the dynamic nature of the rotor itself;
Just as important as the comparisons listed above is the ability to compare transient data before and after a machine problem exists.. Machine condition assessments are much easier when the ability to compare before and after is available.
Similarly, it is very important to evaluate many different types of graphs to display vibration data. Using only one type of chart limits the machine specialist's ability to get a proper “picture” of your condition.
Why turbomachinery starts and stops – diagnostic equipment
Obtaining vibration data from starts and stops requires diagnostic equipment, multichannel, skilled, such as the Meggitt Vibrometer acquisition system shown in the image, based on the letter XMV16 / XIO16T Vibration Monitoring System VM600.

Why turbomachinery starts and stops – Figure 2
Its main features are as follows:
- Designed for operation with VibroSight® software
- 16 dynamic vibration channels and 4 tachometer canais, all individually configurable
- Simultaneous data acquisition on all channels
- Until 20 configurable processed outputs, per channel
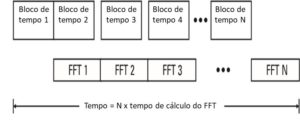
- High resolution FFT up to 6400 lines every 1 s
- Configurable asynchronous and synchronous sampling
- Acquisition of data from 24 bits and data with high signal-to-noise ratio, with data quality checks
- 5 configurable severity levels, per processed output
- 8 detection levels with hysteresis and time delay
- Direct Gigabit Ethernet Communication
- Hardware is fully software configurable
Why turbomachinery starts and stops – the system configuration
The following concerns should be taken into account when configuring the system.
- Number of channels to monitor;
- Number of samples – the sampling method (that is, delta speed or delta time) must be tuned based on machine configuration to ensure enough data is collected for analysis;
- Maximum frequency/number of lines—Depending on machine configuration and purpose of analysis, the maximum frequency and number of rows for the fast Fourier transform algorithm (FFT) become very important. On machines driven by electric motors, acceleration time is often quite fast (that is, less than 10 seconds). for these applications, to get proper data, the maximum frequency should be as high as reasonable to reduce data acquisition time. Similarly, the number of lines should be as small as possible and still provide adequate resolution. If the specialist is primarily interested in synchronous vibration, the resolution will not be as important as the number of samples obtained. However, if multiple non-synchronous frequencies are present in the vibration signal, resolution obviously becomes more important;
- Number of vectors per waveform sample—the sample frequency must be closely examined to provide the correct number of spectra (that is, more vector samples may be needed than necessary to obtain adequate waveform samples);
- Tachometer signal —The tachometer signal is extremely important, because most of the digital analysis depends on this value. For this reason, the voltage change produced by the tachometer must be correctly configured in the software and monitored during data acquisition.
Types of transient data charts
Transient vibration data can be displayed in several different formats. Each type can reveal information that is not readily available in the other.. For this reason, all types should be used when evaluating the condition of a machine. The different types of charts are:
- Bodé/Polar
- Waterfall
- Line of shaft centers
- Orbit
- full spectrum
Bode and Polar Charts
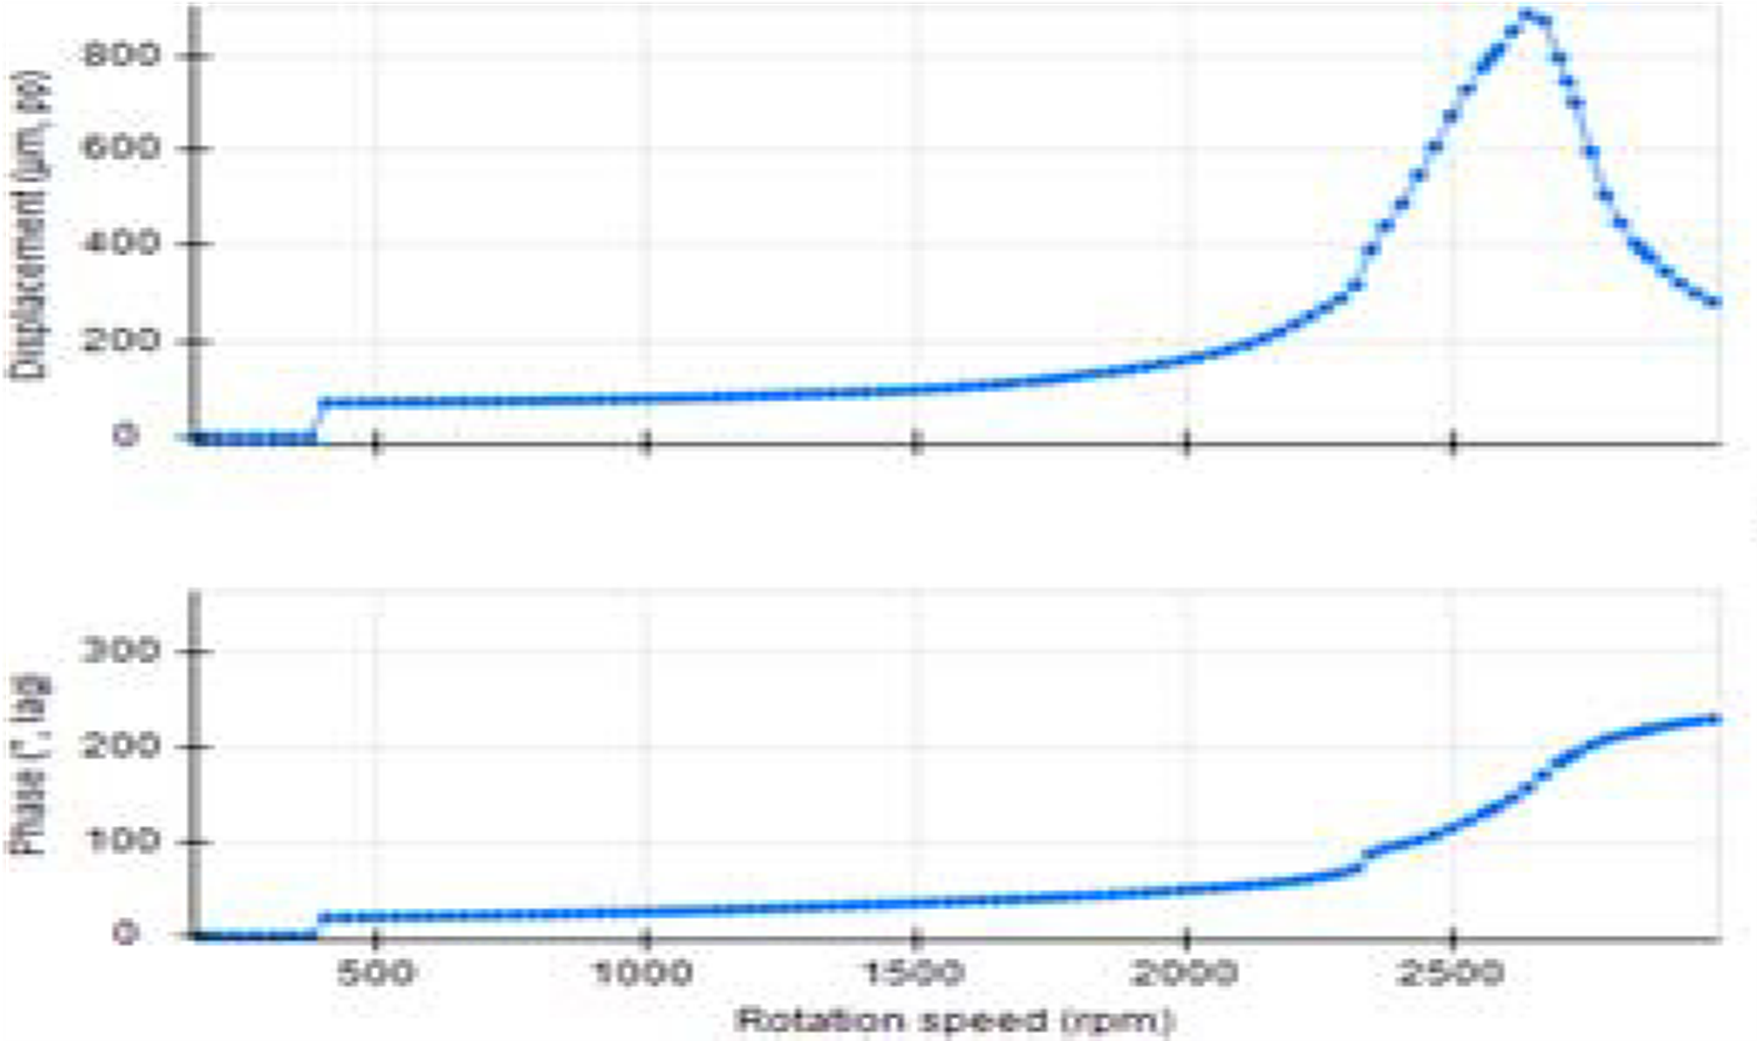
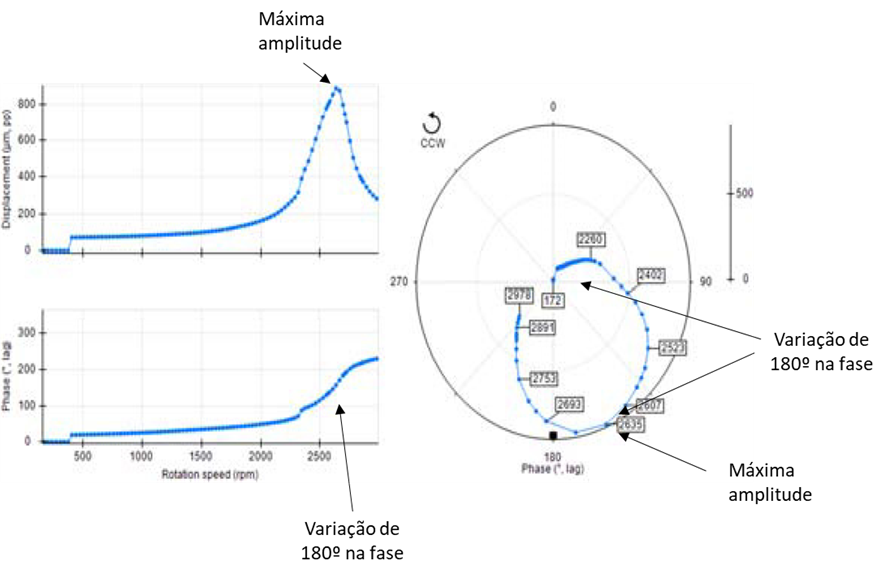
Bodé plots are the most common method of displaying transient data. Typically exhibit global or synchronous vibration (However, nX data can also be displayed) and corresponding phase, versus rotation speed. The natural frequencies of the rotor can be determined by locating the peak in the vibration amplitude that also corresponds to a phase shift of approx. 180 degrees.
Why turbomachinery starts and stops – Figure 3
Polar plots show the same data as Bodé plots, just in a different format. Sometimes, polar plots make it easy to determine when the rotor has crossed its critical speed, because the phase change is obvious (that is, to each 180 degrees on the graph). For example, from the Bodé graph shown in the previous, it is not immediately obvious that this rotor is approaching the second critical speed. However, on the polar graph this is very clear.
Starts and stops of turbomachinery - Figure 4
For the Bodé or polar plot to be more accurate, vector data must be compensated for eccentricity (relative vibrations). All areas where the proximitor measures have some amount of physical and/or electrical deviation. The vector data is corrected for this eccentricity by vectorally subtracting the vibration vector at very low rpm from all the vector data obtained..
The Hunt and the Spectrogram
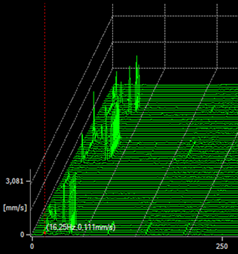
Cascada graphics show the evolution of the spectrum over time or rotational speed.
In their most common presentation they are as in the graph, given below, where do you come from, over time, the spectra corresponding to successive starts and stops of a turbogenerator. For example in this spectral map one can see the emergence of sub vibration- synchronous associated with instability in the oil film bearing.
Why turbomachinery starts and stops – Figure 5
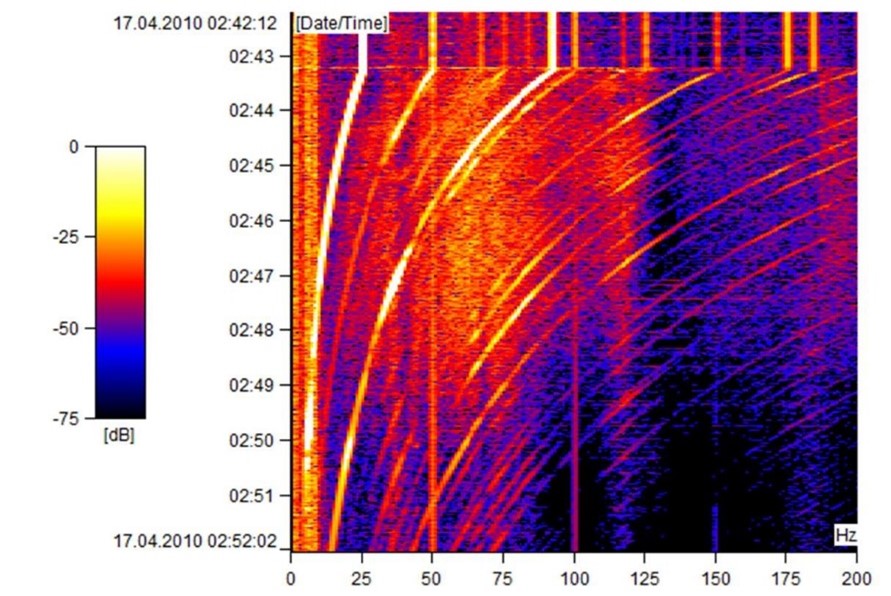
A presentation of the same information, less common, is the spectrogram. This consists of the spectral map, seen from above, in which the colors presented are proportional to the amplitude of the vibrations.
Why turbomachinery starts and stops – Figure 6
The spectral map shown below also shows the evolution of the complete spectrum.
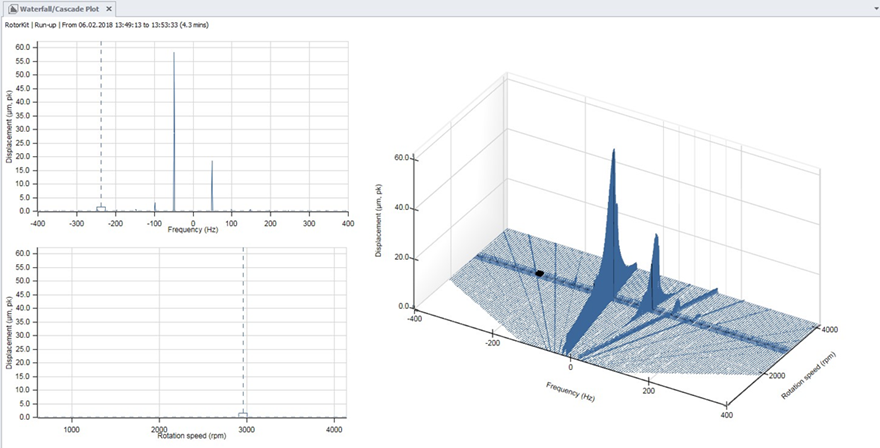
Starts and stops of turbomachinery - Figure 7
On the spectral map of a stop or start, are usually well evidenced, the passages of the rotational speed of the machine shaft by its critical frequencies, as you can see below.
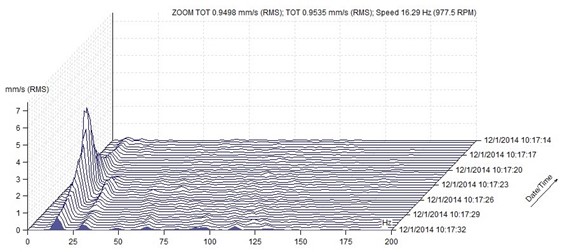
Why turbomachinery starts and stops – Figure 8
The Orbit
The time signal provides important and useful information, but as the shaft moves along a two-dimensional path, this information is limited. In this type of movement, on anti-friction metal bearings, where the oil film dampens vibrations in the bearing housing, the signal in time, supplied by an accelerometer, it is not the most suitable. To monitor this movement, displacement sensors that measure the relative vibration between the shaft and the housing, are more suitable, especially when installed in pairs.
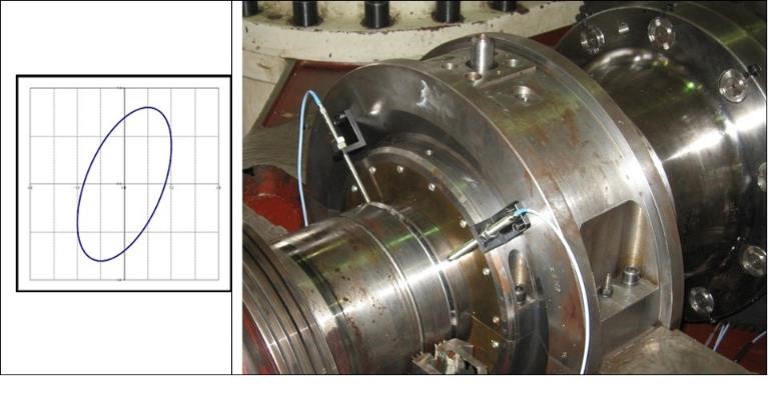
Why turbomachinery starts and stops – Figure 9
With two relative vibration displacement sensors (proximitors) there are conditions to know the movement of the center of the shaft in this plane. This information can be presented in two individual time signals, respectively to each sensor, more or ideal, is to obtain a graph that represents the two dimensions of the movement of the shaft. This graph is designated by orbit. The orbit represents the path from the center of the shaft in the reading plane of the pair of proximity sensors. The sensors are rigidly mounted on the machine frame, next to the support areas of the shaft (bearings). Like this, the orbit represents the trajectory of the center of the shaft relative to the structure of the machine. Due to the easy interpretation and amount of information that the graph contains, the hourglass, reconciled with a phase indicator, also known as a phase sensor, is an effective graph to understand the physical phenomena that occur on rotating machines.
In the following graph you can see an Orbit filtered at rotation speed.
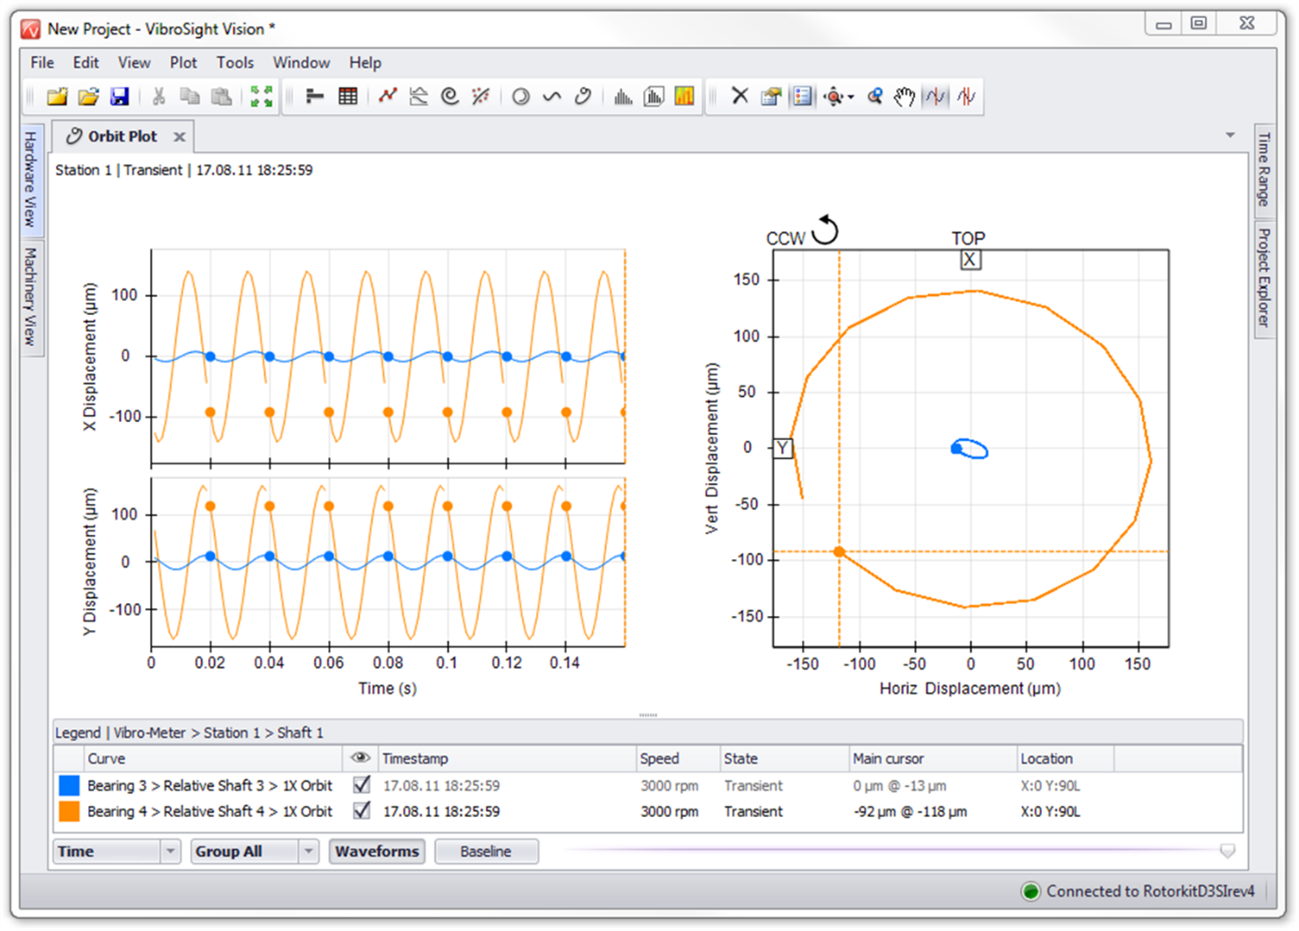
Why turbomachinery starts and stops – Figure 11
Below you can see the waveforms measured in pairs of proximitors placed at 90º and the corresponding unfiltered orbits.
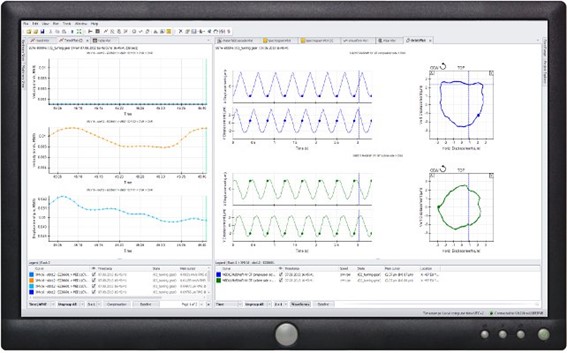
Why turbomachinery starts and stops – Figure 12
Orbits can also be displayed over time or rotation speed, as seen below.
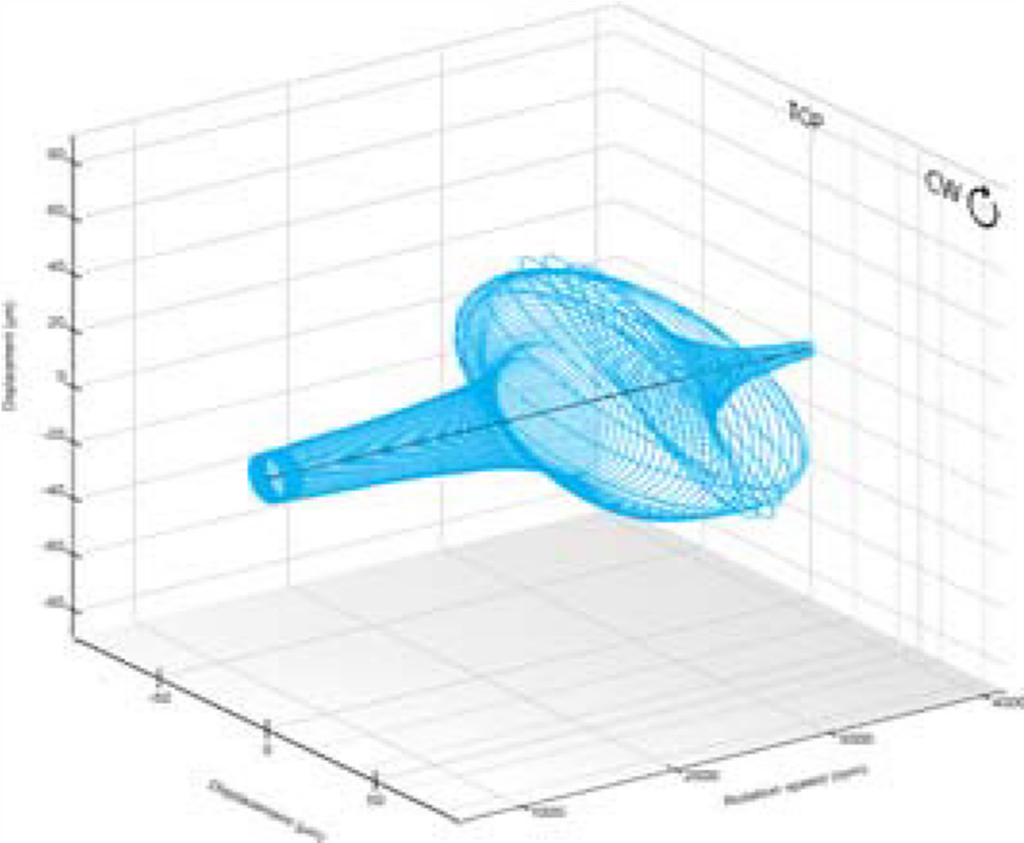
Why turbomachinery starts and stops – Figure 13
When using proximitors as vibration sensors, the use of the orbit is essential for the understanding of the physical phenomena in question.

