Temporary monitoring vibrations – practical case
In this article we present the temporary monitoring vibrations and a practical case of application.
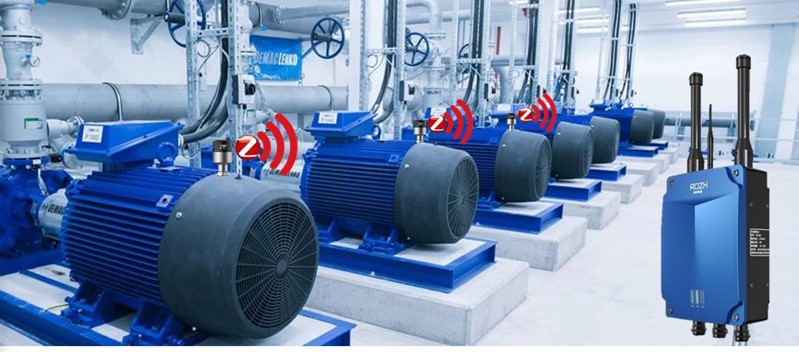
1 With the temporary monitoring vibrations always know how is the machine that concerns
In vibration monitoring temporary wireless sensors are connected alternately via the monitor:
- industrial computer network;
- An external source, through a card 4G,
2 The condition monitoring of critical machines
Since always, it was obvious, that critical machines deserve special surveillance, lying situations where this need collided with what was possible, such as, for example, the two following situations.
2.1 sTATUS – Temporary monitoring vibrations – practical case
Currently there is common critical machines whose monitoring condition is performed based on regular measurements, made with a vibration analyzer laptop. This monitoring is usually carried out at regular intervals, for example, with a weekly vibration analyzer. There are many facilities in which these machines are not duplicated and that his arrest implies a loss of production and where it is essential that maintenance shutdowns are planned in order to be optimized.
When an alert is triggered immediately put two questions:
- What causes?
- How long will the machine work, a fault occurs without stopping by?
The first question is answered through a diagnostic Vibration Analysis, often based on the use of a vibration analyzer.
The answer to the second is made dependent on the diagnosis and assessing the degree of damage severity, always carried out with a probabilistic basis. The machines in these conditions come in a surveillance phase, it is normal that the interval between inspections is shortened, to try to determine the evolution rate of breakdowns.
Associated to the second question is always another, that is whether the machine can be operated until the next stop, already planned.
The difficulty of this preview is related to the evolution of the failure modes and the fact that some of them have a probability of occurrence with random character, as shown in Figure 1, then presented.
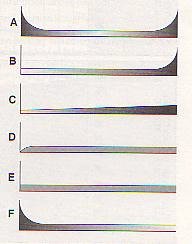 Figure 1 - Probability of occurrence of failure modes of a component, throughout his life
This is where the need arises to obtain information about the machine, more often, for example, from hour to hour.
In the past, with inspections carried out with portable equipment, this was not feasible.
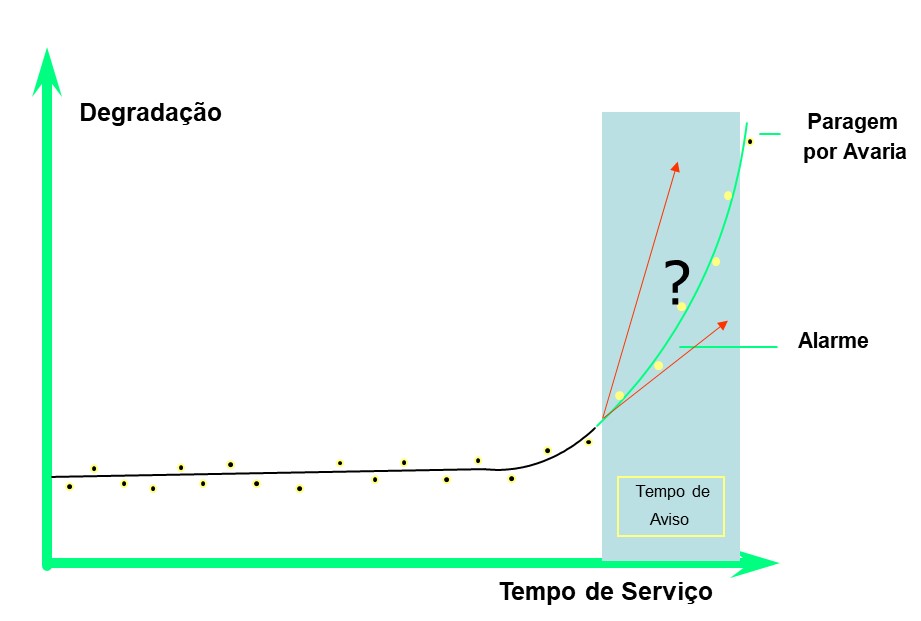
Figure 2 - The urgent need to know the real speed of evolution of the damage.
2.2 situation B – Temporary monitoring vibrations – practical case
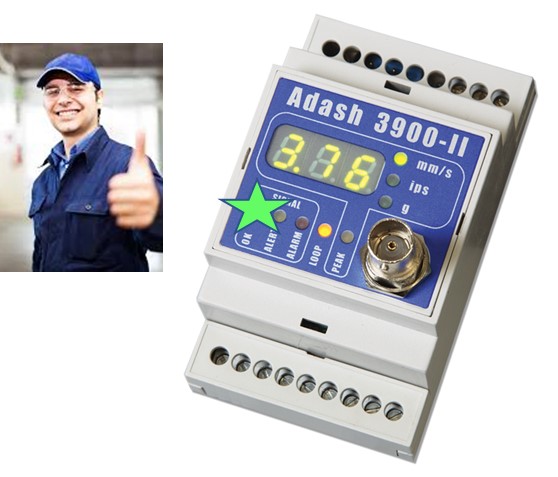
another situation, which is also a common mode, is the existence of critical machines, supervised by permanent monitoring systems for protective vibrations, which are stopped by triggering a relay, measuring the excessive vibration monitor, but that their technical managers do not have any information about what stopped.
|
no alarm machine |
Machine with alarm |
 |
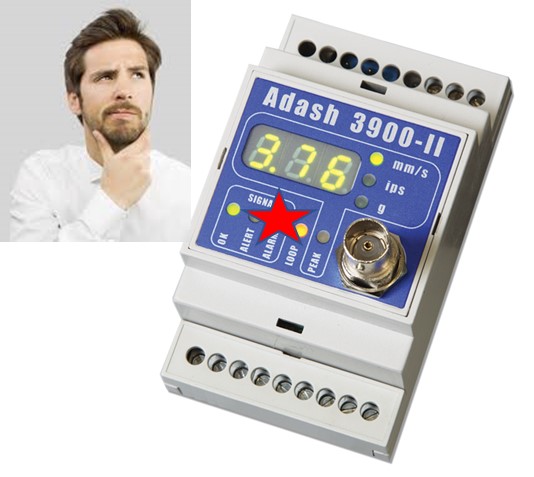 |
Figure 3 - Dilemma technical manager - intervene or not intervene?
In this situation we are faced with the following alternatives:
- Start the machine and run the risk of destroying;
- Perform a maintenance intervention on the machine and run the risk of not finding anything.
Also at this time we feel the need to have more information, Now diagnostic, for a decision on whether or not to intervene on the machine, It is made with more and better information.
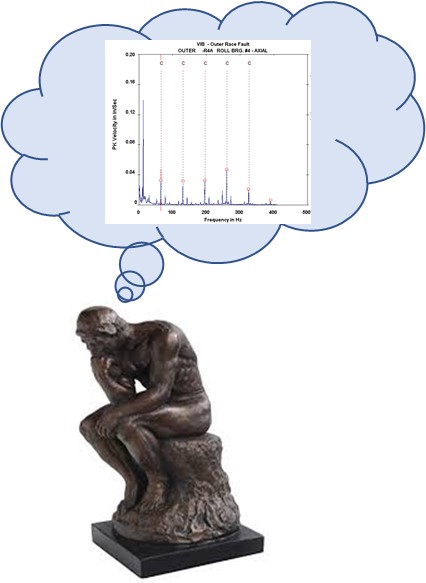
Figure 4 - The need for more information about the machines, in order to make the best decisions ....
3 The difficulties associated with temporary monitoring vibrations
Although this possibility had always existed, and sometimes were used, the reality is that associated with its implementation were so many difficulties, ie cost, what, as a matter of fact, It was almost never used. Examples of difficulties:
- installation of sensors and cables;
- Access to information.
4 – Sistema wireless - the solution for temporary monitoring vibrations
The wireless systems are the current response to these needs.
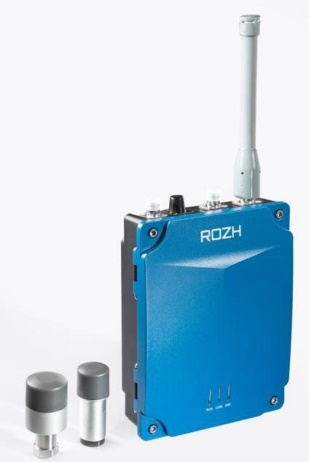 Figure 4 - Vibration monitoring wireless system
The fact that no connection to power cables and facilitates its installation very sensors.
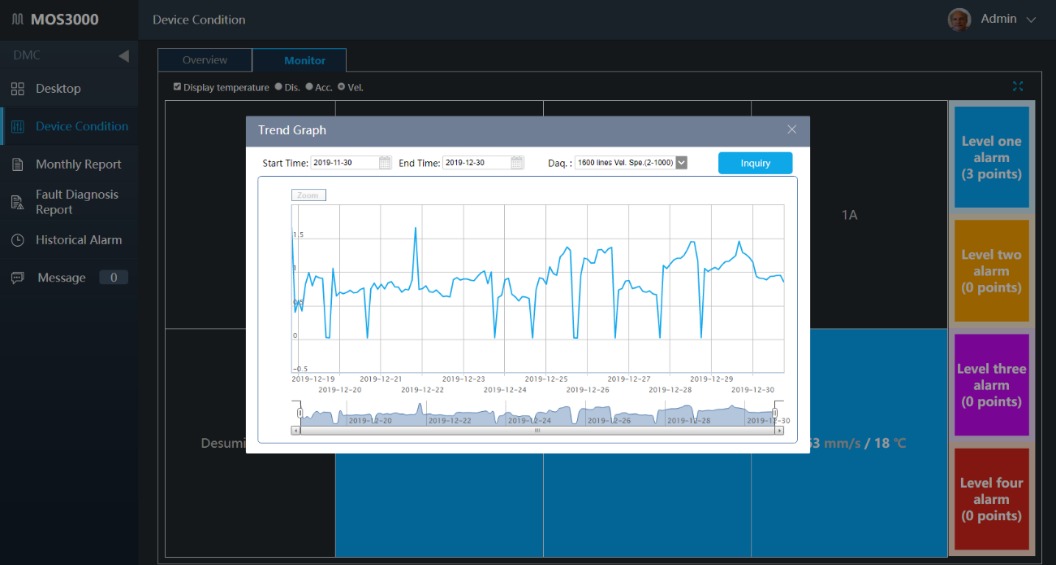 Figure 5- Access to information on the latest measurements on the machine via browser.
Also the fact that the results of the measures be accessible via browser allows that all stakeholders have access to the latest most relevant information.

Figure 6- Access to detailed information on the latest measurements on the machine through client-server application.
For those who want to know more, applications client-server enable access to more complete information.
5 – The wireless monitoring system
5.1 general Scheme
The monitoring system of intelligent wireless condition, It is designed to disperse measuring points and without cables. Integra vibration signals, temperature and rotational speed.
The system hardware includes the wireless monitor RH560, the integrated wireless vibration sensor and temperature RH505 and RH509 wireless speed sensor. The PC software online MOS3000 is used to monitor real-time conditions of the machine, help users identify in advance the failure of the machine and avoid unplanned downtime.
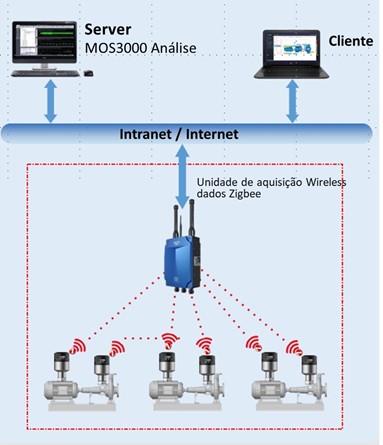
Figure 7 - General scheme of the temporary wireless vibration monitoring system
The wireless monitor RH560pode be connected to the factory computer network or, with a card 4g, to a remote server.
5. 2 The wireless vibration transducer
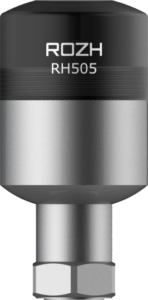 Figure 8 – Transducer wireless vibrations RH505
The wireless vibration transducer, used in temporary monitoring vibrations is, de facto, a powerful vibration analyzer, with sophisticated frequency spectrum analysis capabilities.
Its characteristics are as follows
- Acceleration sensor and internal temperature, collects velocity signals, acceleration, both displacement and temperature.
- The vibration signal can be displayed as a waveform and spectrum software.
- The Zigbee communication, Non-local use, It provides strong anti-interference and transmission capacity of up to 100 meters from the data collector.
- Φ42mm * h65mm , small volume, easy to maintain.
- The design of low-power battery collects data every two hours. This operation is sustainable by 2 years or more.
- Intelligent self-check function, abnormality notice at any time.
- Exia ⅡCT4 can be used in the area 0, IP67, waterproof and dust.
| RH505 vibration sensor and integrated temperature Wireless | |
| Vibration measurement parameter | |
| Acceleration Range | ±50 g |
| linearity | 1% |
| Frequency Range (±3dB) | 2 Hz-15kHz |
| Temperature Measurement | |
| Temperature range | -40~125 ℃ |
| Precision Temperature | ±1 ℃ (-40℃~125℃) |
| electrical and mechanical parameters | |
| food | Baterias Lithium – thionyl chloride, 3.6V, 3.3Ah |
| Communication method | 2.4GHz IEEE 802.15.4 |
| dimensions | 46 mm × 94 mm (Diameter * Height) |
| Weight | 188 g |
| environmental parameters | |
| Operating temperature | -40~70 ℃ |
| IP wheat | IP67 |
measurements made:
- parameters: displacement, velocity, acceleration, temperature
- Level: RMS, pk-pk, kurtosis,
- Acquisition and Processing: wave shape; I any spectrum, envelope;
- Maximum number of waveform samples:128000
- Number of spectrum lines. 400, 800,1600,3200
- cursors: simple, Harmonic, frequency characteristics
5.3 Tacómetro Wireless RH509
The machines can be equipped with a wireless tachometer to know its speed.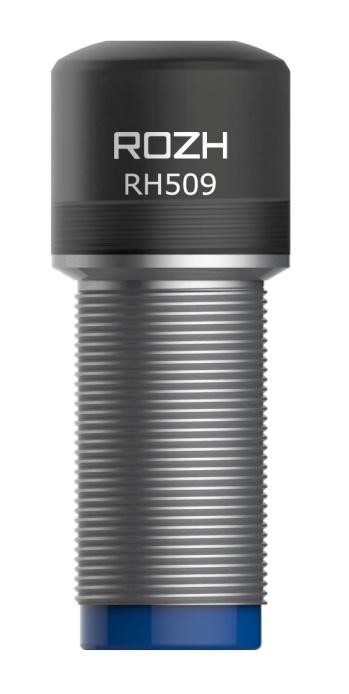
Figure 9 -Tacómetro Wireless RH509
Its characteristics are as follows:
| Tacómetro Wireless RH509 | |
| Measuring characteristics | |
| Measuring range | 60~3000 RPM |
| Accuracy of measurement | 60~3000 RPM ±0.5 RPM |
| Response away | 17 -19 mm |
| electrical and mechanical parameters | |
| food | Bateria Lithium – thionyl chloride , 3.6The 2.4Ah |
| Communication method | 2.4GHz IEEE 802.15.4 |
| dimensions | 37 mm × 94 mm (Diameter * Height) |
| Weight | 85 g |
| Assembly | Support |
| environmental parameters | |
| Operating temperature | -20~70 ℃ |
| IP Wheat degrees | IP67 |
5.4 Frequency of measures
The measurements are made with three different periodicities:
- overall level of periodic vibrations (for example: 3 minutes);
- Spectrum rolling frequency (for example: 1 hour)
- When there is a global alarm vibration spectra can be collected .
5.5 Alarms via email and SMS
When the alarm level is reached the system can be parameterized to send an email or SMS for those interested.
5.6 O software MOS3000
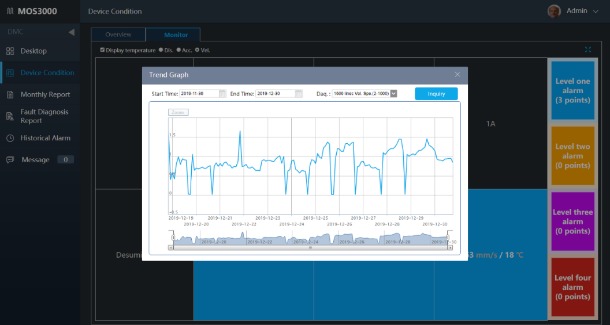
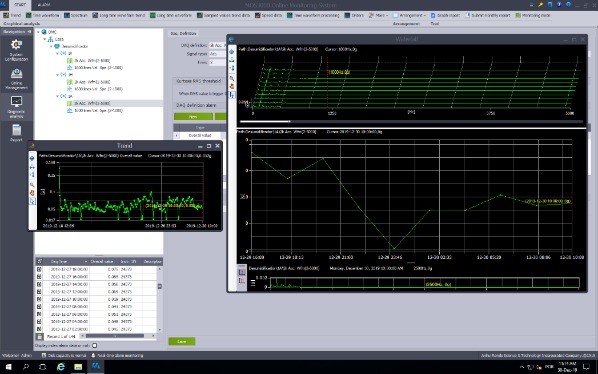
The MOS3000 program exists with two interfaces: the browser and client-server program.
 |
 |
| Interface no browser | Interface software in client-server |
Figure 10 -No program interfaces MOS 3000
The browser interface provides a simpler information, with recent trends and measured values.
The interface on the client-server program provides all diagnostic features necessary for technical effecting vibration analysis.
Presentation: trend, I any spectrum, multi-espetro, espetral map, Cepstro, envelope, etc
6 - practical application Example Vibration Analysis as temporary monitoring vibrations
A turbo-generator with a few tens of Megawatts, with a protective system based on proximitors, sometimes stopped by excessive vibration, measures for the permanent display.
Managers of active wanted to know if there was a problem with the machine or is it a problem on the monitor. To this was fitted a temporary vibration monitoring system, with a wireless accelerometer in which the bearing vibration monitor, Occasionally noted excessive vibrations.
The system was customized to perform the following measurements:
- Acceleration – waveform - each 2 minutes
- Acceleration - overall value - each 30 seconds
- Speed - spectrum (2-1000 Hz) and overall value - each 2 minutes
Below you can see the corresponding graph the measurements made between 23 August and 17 of September.
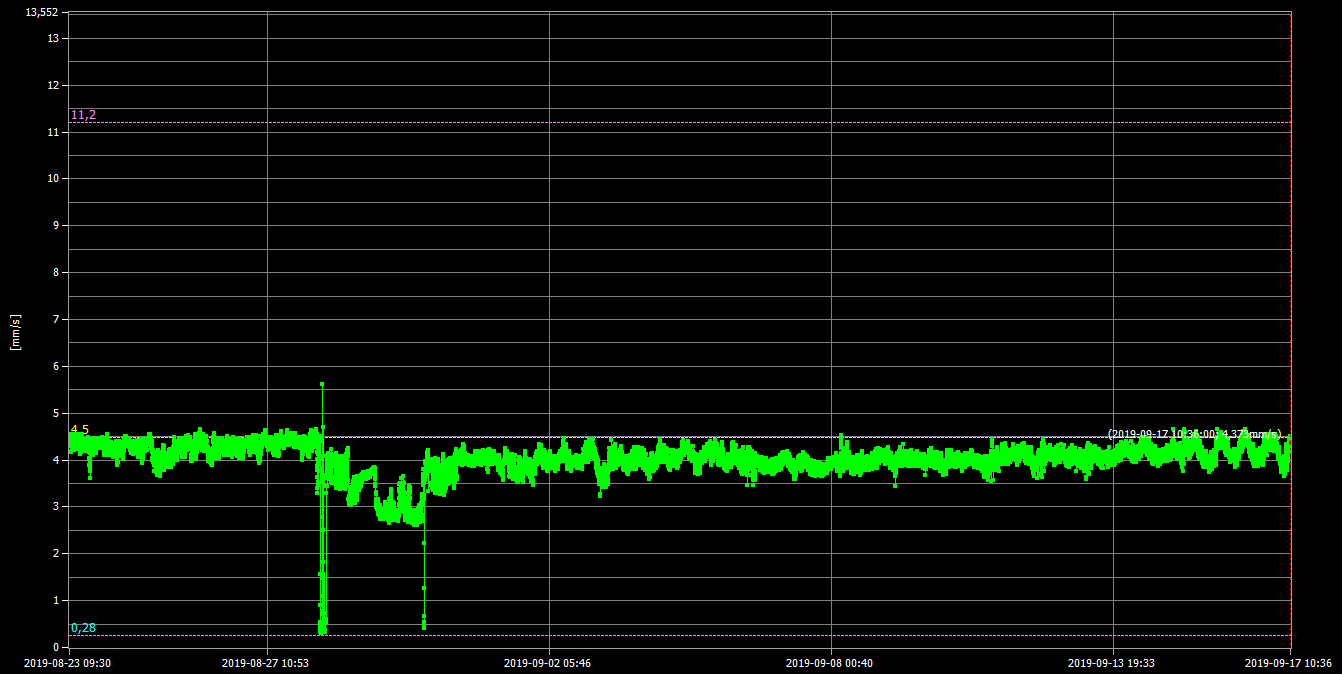
Figure 11 - Temporary Vibration Monitoring – practical case – between 23 August and 17 of September.
As shown in the chart, this period occurred machine stops, no day 28 e 30 of August, triggered by the monitor protective vibrations, that excessive vibrations measured.
The following can-vibration graph details, the stop on 28 of August.
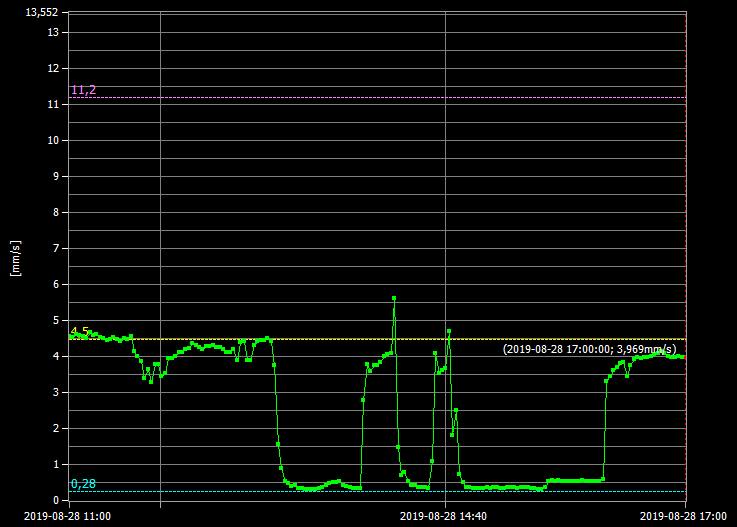
Figure 12 - Detail of the temporary vibration monitoring – practical case – no day 28 of August, where you can see three stops with climbs of light vibration levels in the last two.
In this graph of two measurements in two minutes, you can see that on 28 of August, occurred three stops. In this graph, the latter two show vibration level rises before stopping.
Below you can see the corresponding spectral map to this period.

Figure 13 - Map corresponding spectral temporary monitoring vibrations – practical case – no day 28 of August.
Here one can see a previous graphic description.

Figure 14 - figure graphic detail 13 – Temporary monitoring vibrations – practical case
In the chart shown below you can see a spectrum collected at the beginning of one of the stops.
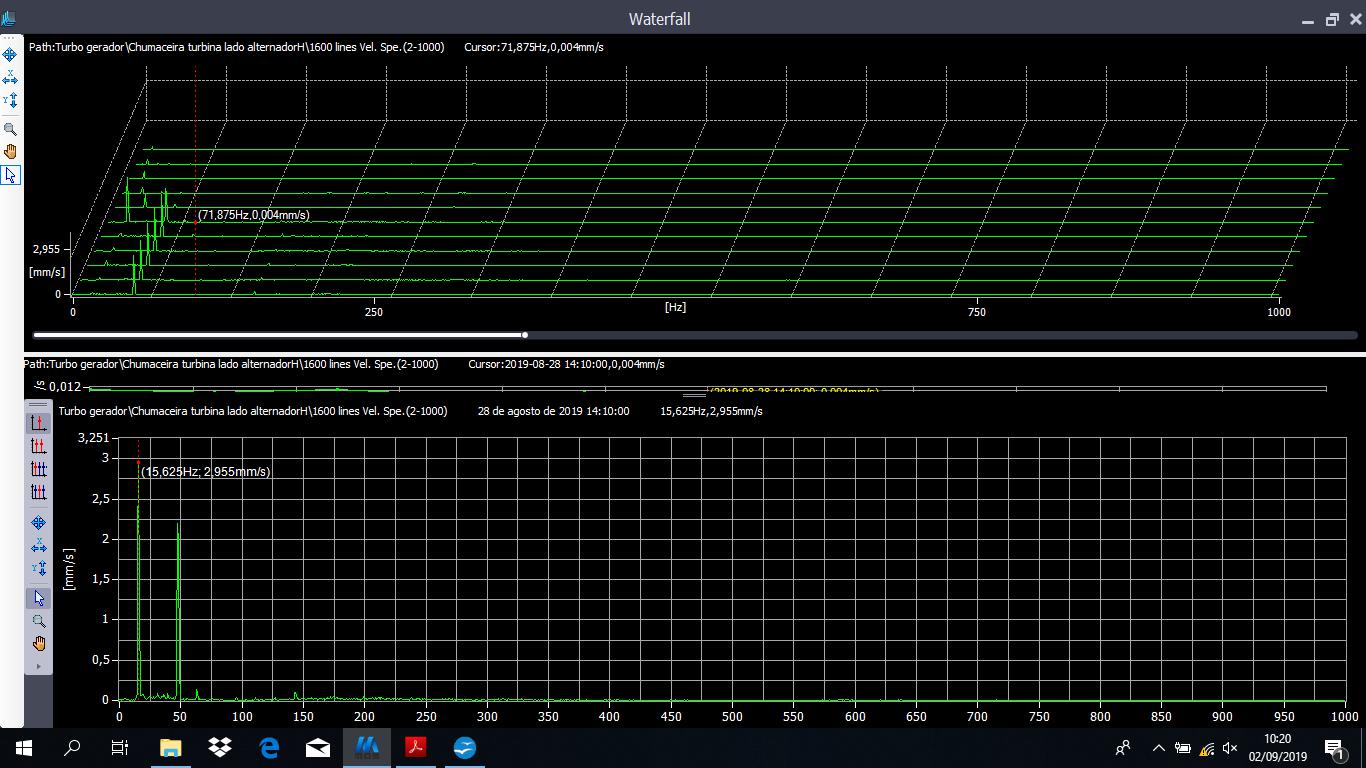 Figure 15 - frequency spectrum collected at the beginning of a stop, corresponding to temporary monitoring vibrations – practical case – no day 28 of August
In this spectrum, one can see that the sub-synchronous component is predominant and corresponds to approximately 72 microns peak-to-peak, absolute vibration. Measured in relative vibration, would be, probably, much more.
In these charts you can see that:
- The component of rotational speed, a 50 Hz, It is almost always predominant;
- There is a permanent sub-synchronous vibration 16,25 Hz, almost always less than synchronous vibration;
- some moments, to coincide with the stops, sub-synchronous component, becomes predominant.
This sub-synchronous component was related to instability of the oil film, driven by oil temperature variations. The height of the stops, coincides with a period of summer with very high average ambient temperature.
7 – Conclusion
For this example, you can see the additional information provided by a wireless system of temporary vibration monitoring and its usefulness in decision support.

