Integration of vibrations and thermography into routine
Integration of vibration analysis and thermography into routine - Example 1
Introduction
The following is a practical example of integrating analysis vibrações e thermography inspection routine.
Currently, the highest cost of implementing a predictive maintenance system is the cost of personnel to implement it. De facto, this cost far exceeds the cost of the initial investment in the acquisition of equipments. Like this, there is a great concern to make the most of the work of technicians who implement inspection techniques.
2 Integration of vibration analysis and thermography into routine – the vibration analyzer as a platform for integrating predictive maintenance technologies
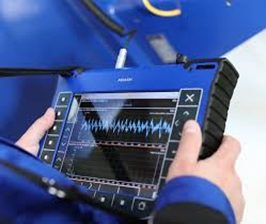
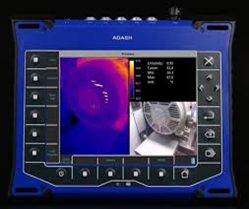
Below you can see images of this equipment, with the functions of analyzer and thermography camera.
 |
 |
|
Analyzer |
Camera and thermography |
De facto, this equipment integrates the following predictive maintenance technologies:
- Vibrations - analyzer and data collector;
- thermography;
- Analysis feed stream;
- Ultra-sons;
- Camera;
- Stethoscope;
- Signal Recorder;
- On-site balancing equipment;
- Lubrication control.
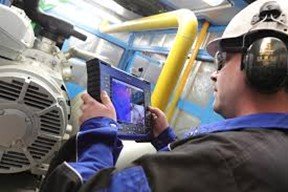
Like this, when you want to use, the thermography chamber is connected to a USB plug, on the top of the equipment, as you can see in the images.
 |
 |
That way, the thermography camera usually goes in the inspector's pocket and is assembled when he intends to use it. Like this, can be used optimally in the inspection work and the images obtained are automatically integrated into the reports.
3 – Integration of vibration analysis and thermography into routine – computer application
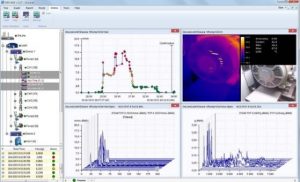
Like this, o DDS program to ADASH, is the computer application that integrates the different technologies. De facto, allows to generate vibration and thermography inspection reports, automatically. This way relieves the bureaucratic burden associated with inspection work.
4 – Integration of vibration analysis and thermography into routine - Example 1 - hot engine
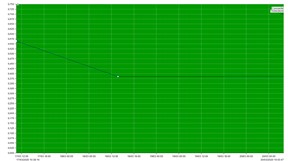
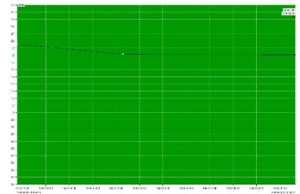
In a vibration measurement routine, performed with ADASH VA5 Pro, these were measured on an electric motor, nothing abnormal was detected. This can be seen in the global level graphics and the acceleration envelope, presented below.
 |
 |
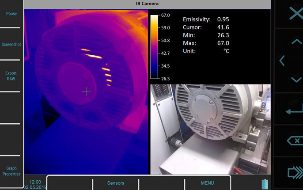
However, the technician felt the engine was hot. How had the thermography equipment, decided to perform a thermographic inspection.
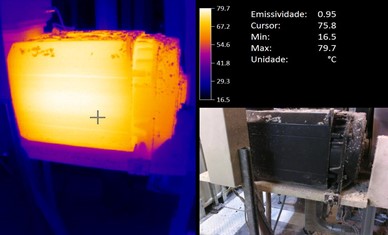
He immediately found that it had a maximum temperature of 80ºC. Like this, drew the attention of those responsible for maintenance to this fact.
When the engine was inspected, it was seen that the engine fan was clogged with dirt. In consequence, cleaning was carried out.
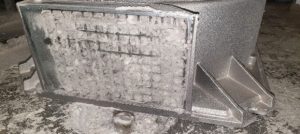 |
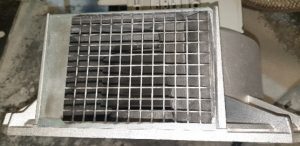 |
Upon startup, a thermographic inspection was carried out again.. At this time it was found that its operating temperature dropped from 80ºC to 33ºC.
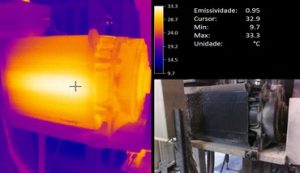
5 – Conclusion
Since the operating temperature of the motor is a factor of degradation of its insulation, the inspection has at least made a significant contribution, for your improved reliability. At worst, avoided a fire.
The potential of integrating vibration analysis and thermography into routine is fully demonstrated in this example.

