Vibration analyzer 11 – Functions 2 channels on frequency
The specific topic dealt with in a vibration analyzer 11, consists of the functions of 2 channels in the frequency domain, in a vibration analyzer as part of a program of predictive maintenance.
When it takes place Vibration Analysis, to take advantage of the full potential of a vibration analyzer, you need to understand how it works. Therefore, here are presented the concepts of digital signal analysis, currently implemented on an FFT vibration analyzer, in a vibration analyzer as part of a program of measuring vibrations.
We begin by presenting the properties of the Fast Fourier Transform (FFT) on which Vibration Analyzers are based. Then, it shows how these FFT properties can cause some undesirable characteristics in the analysis of the spectrum, like aliasing and breakouts (leakage). Having presented a potential difficulty with the FFT, shows what solutions are used to make vibration analyzers practical tools. The development of this basic knowledge of the characteristics of the FFT makes it simple to obtain good results with a vibration analyzer on a wide range of measurement problems.
Here you can see the range of Vibration analyzers made available by D4VIB.
- What is the relationship between time and frequency
- How sampling and scanning works
- What Aliasing is and what effects it has
- How it is used and what the zoom consists of
- How waveform windows are used
- What are averages for
- What is real-time bandwidth
- What overlay processing is for (“overlap”)
- What is order tracking
- What is envelope analysis
- The two-channel functions in the frequency domain
- What Orbit is for
- What are the functions of a channel in the time domain
- What the Cepstro consists of
- What are the units and scales of the spectrum
11 Functions 2 channels on frequency
11.1 The frequency response function
The H frequency response function(ω) in the frequency domain and the impulse response function h(t) in the time domain are used to describe the input-output relationships (force-response) from any system, where the signal a(t) e b(t ) represent input and output of the physical system. The system is considered linear and time-invariant. The frequency response function and the impulse response function are the so-called system descriptors. They are independent of the signals involved.
In the following table, you can see the typical formulations of the frequency response functions.
| Dynamic stiffness | Force / displacement |
| Flexibility (receptância) | Displacement / Force |
| Mechanical impedance | Force / Speed |
| Mechanical mobility | Speed / Strength |
| Dynamic inertia | Force / Acceleration |
| Acceleration | Acceleration / Force |
Note: definitions in the ISO NP 2041.
Below you can see a video about frequency response functions.
Transfer functions are widely used in the analysis of mechanical systems. For this it is normal to excite the structure with a hammer or vibration exciter and measure the response with accelerometers.
For example, in mechanical structures, the characteristics of the transfer function will show dangerous resonances. The frequency band, where the material tension is very high, should be avoided, for example specifying a rotation speed to avoid. The simplified process works like this: an input signal is applied to the system and the output signal is measured.
The division between response and excitation basically provides the transfer function.
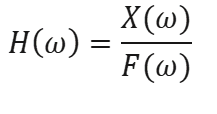 In that: ω = 2 p f
that is:
![]()
11.2 How to obtain the transfer function in a mechanical structure
- Excite the structure with a hammer or vibration exciter by measuring the dynamic force;
- Measure response with accelerometers (acceleration)
- Calculate the transfer function between the measured input and output system measurements
- Calculate the coherence function. If consistency is 1, the measured response is caused entirely by the measured input. If coherence is less than one at any frequency, this indicates that the measured response is greater than due to the measured input, that is, there is noise at the entrance or at the exit.
11.3 Functions 2 channels in the frequency domain – The coherence function
Coherence is function versus frequency, which indicates how much of the output is due to the input in the FRF. May be an indicator of FRF quality. Evaluates the consistency of the FRF from measurement to repeating the same measurement. The value of a coherence function varies between 0 e 1.
So Coherence is a graph that represents the correlation between two signals in the frequency domain. Two signals are considered coherent if they have a constant phase difference and the same frequency and waveform. The coherence graph shows how the response signal is related to the input signal. Values for consistency will be between 0 e 1, where a value 0 indicates that there is no relationship between the two signals and a value 1 indicates that there is a perfect relationship between the two signals.
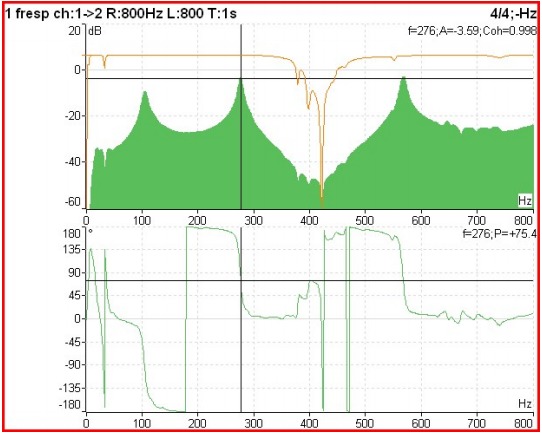
In the graph below presented from an impact test on a bearing of a machine in which the vibratory response of the structure to a shock generated by a hammer instrumented with a force sensor is measured, it is possible to observe the:
- mechanical mobility (full green, on)
- coherence (Brown, on),
- phase relationship (below)

Functions 2 channels in the frequency domain – Figure 11.1 – The frequency response function, coherence and phase
When the amplitude of an FRF is too high, for example at a resonant frequency, coherence will have a value close to 1. When the amplitude of an FRF is too low, for example at an anti-resonance frequency, coherence will have a value close to 0. This is because as the signals are very small, its repeatability is rendered inconsistent by the instrumentation noise level. This is acceptable/normal. When coherence is closer to 0 than 1 at a resonant frequency, or over the entire frequency range, this indicates a problem with the measurement. Problems can include:
- instrumentation error – For example, no ICP power is being supplied to transducer requiring ICP power
- inconsistent excitation – The structure is not being hit by a consistent impact hammer (for example, the operator is tired and impressively framed at different angles between impacts)
- insufficient strength – The structure is not being excited. For example, a very small hammer (example: pencil size) over a large object (example: bridge size) with a large distance between excitation and response measurement
- Note that if only one measurement is performed, coherence will be a value of 1! The value will be one across the entire frequency range. – giving the appearance of a measurement “perfect”. This is because at least two FRF measurements need to be taken and compared to start calculating a meaningful coherence function..
11.4 Obtaining the transfer function with an impact test
In this test the structure under study is subject to an impact, that will excite all of your natural frequencies, then vibrating freely. For this purpose, an instrumented hammer is used to measure the force of the impact.
This test is performed with the following instrumentation:
- Two-channel analyzer
- Accelerometer
- Hammer instrumented with force sensor

Functions 2 channels in the frequency domain – Figure 11.2 - Measurement of the frequency response function with an impact test
From the acceleration signal, which measures the response of the structure and the strength signal, introduced into the structure by the instrumented hammer, three parameters are calculated:
- Frequency response function (FRF);
- Phase between channels;
- Coherence between channels.
Here you can see a video about the impact test.
The FRF function is responsible for determining the frequency response of the structure. For this, the FRF function relates the input data to the output data. In this case, the input consists of the excitation force applied by the hammer and the output the vibration measured by the accelerometer, obtaining in the end the relationship between the two signals, in a vibration analyzer as part of a program of. in a vibration analyzer as part of a program of, unequivocally defines that we are in the presence of a natural frequency because, in resonance the phase varies 180º. If this variation is less than 180º, it means that, or the structure is heavily cushioned or else, that the movement of the structure in the resonance does not occur in the direction of the accelerometer and / or the hammer. Coherence between signals is a measurement that aims to validate the impact test, establishing the relationship between how much of the output vibration (answer) was caused by external excitation (force applied by the hammer), that is, if all the output vibration is caused by the impact of the hammer, the coherence value would be 1. If the coherence value of the test is greater than 0,75, the collection can be considered valid. If it is less than 0,75 it means that the vibration was not only caused by the impact of the hammer, but also, by other external forces.
As already mentioned in point 5, this test uses a uniform window for the hammer signal (upper graph with the measured signal and the window) and an exponential window for the accelerometer signal (bottom graph) as can be seen in the figure below.
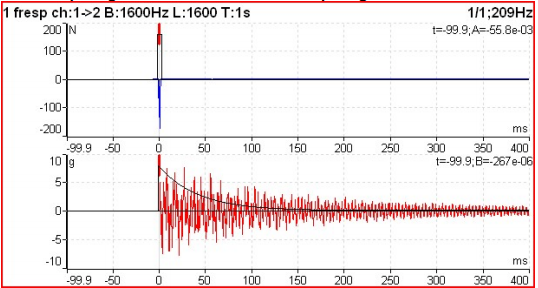
Functions 2 channels in the frequency domain – Figure 11.3 – Impact test windows
Here you can see a video with the practice of this test.
11.5 The phase between channels
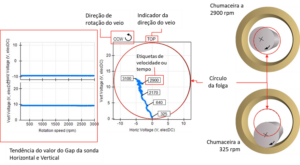
The cross-channel phase of the transfer function, can be used to know the relative movement of two bearings or machine parts, sem tachometer.
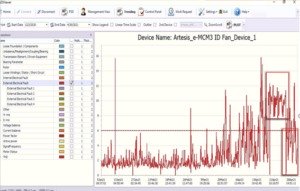
The following is an example of using phase measurement between channels (a 1x RPM) to check where there are looseness. In tight joints the phase is approximately equal. If there is a loosening this does not occur.

Functions 2 channels in the frequency domain – Figure 11.4 - Phase measurement for looseness identification.