Thermography Equipments
The topic covered in this article is thermography and image acquisition equipment.
1 Thermography equipment – Thermography inspection
The faults of, for example, an electrical power substation, typically may experience problems related to high electrical resistance, short circuits, open circuits, inductive heating, harmonics, load imbalance, overload and incorrectly installed components. Problems that are generally detected by thermography.
The figure shows a typical scene from a thermographic inspection in a high voltage substation, in which the main characters of this action are present: Inspector, thermography camera, equipment under inspection and the environment surrounding them.

Thermography equipment – Figure 1 – Thermographic inspection of substation equipment.
A seemingly simple activity, in which the inspector operates the thermography camera, points it to the equipment under inspection and detects the defect by analyzing the thermogram obtained.
1.1 Thermography equipment – Influences and limitations
Although, There are influences and limitations in this process that can lead to an incorrect diagnosis or even make it impossible to detect the defect.. The low emissivity of the components under inspection, the variation in the load current of the inspected equipment and small components at large distances are examples of factors that make thermographic inspection difficult. In open environments, in addition to the factors mentioned, environmental influences such as solar radiation, atmospheric attenuation, the wind, changes in ambient temperature, rain and humidity may be present. Taking all this into consideration, a more detailed representation of a thermographic inspection is shown in the figure.
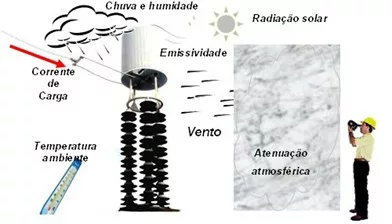
Thermography equipment – Figure 2 – Thermographic inspection of substation equipment with possible influences.
1.2 Thermography equipment – What thermography cameras measure
It is also important to highlight that thermography chambers do not measure temperature directly.. Detect thermal radiation that reaches your detector, which in turn, generates an output signal, due to this radiation, which is processed and transformed into visible images and temperature readings. Although, the detected radiation may originate not only from the object under inspection, but from other sources involved in the environment in which the object is inserted. Besides that, the value of the output signal strength, generated by the detector, associated with some parameters provided by the thermography camera operator, as emissivity, distance from the object to the thermography chamber and other parameters related to the environment are necessary to calculate the temperature of the object under inspection. Therefore, the accuracy of the temperature measurement depends on the calibration of the thermography chamber and the accuracy of the parameters entered by the operator.
In this more complex scenario, the limitations and characteristics of the characters involved in thermographic inspection must be considered for a consistent and reliable analysis of the thermal anomalies found.
1.3 Thermography equipment – The inspector
One of the main factors limiting thermographic inspection is the thermography inspector himself. Your motivation for carrying out the inspection can directly affect the results, both in relation to the number of abnormalities found, as well as the quality of the thermal images obtained. Besides that, he must know the operation and characteristics of the thermography camera used, as well as the operation of the equipment under inspection. You must be aware of the strong influence of solar radiation, of wind and rain and how they drastically affect the thermal distribution of objects in open environments. Must know the basic theory surrounding infrared radiation and the principles of heat transfer, essential knowledge for a correct analysis of thermograms and the functioning of the inspected equipment. summing up, to get consistent results, the inspector must be motivated and qualified for inspection, have a high level of training and knowledge, so that you can be able to detect all possible faults and discern between a real defect and a false anomaly, which can save thousands of dollars in unscheduled downtime and/or downtime and unnecessary maintenance. Therefore, investment in training and qualification becomes important and necessary in reducing errors inserted by the thermography inspector in the inspection results.
2 Thermography equipment – The thermography camera
The thermography camera is the main instrument of a thermographic inspection. Through it, the infrared radiation emitted by the object is detected and converted into a visible image and temperature readings..
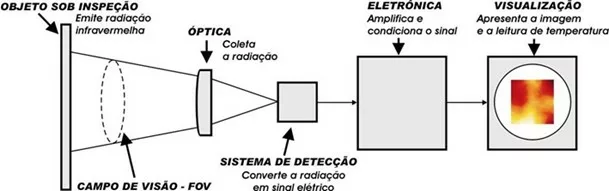
Thermography equipment – Figure 3 – Simplified diagram of a generic thermography camera.
The correct choice of thermography camera for inspection depends on knowledge of the technical characteristics of the thermography camera, the environment where it will be used and the type of component that will be inspected. For example:
- The temperature of the object to be inspected defines the temperature range and the best wavelength range that the thermography camera should respond to..
- The distance and dimension of the object to be inspected defines the spatial and measurement resolution.
- The temperature of the inspection environment defines the operating temperature range of the thermography camera; etc.
Therefore, It is important to know the characteristics of the thermography camera and direct them to the application in question, which in this case is the inspection of high voltage substations in open environments.
2.1 Thermography equipment – Thermography camera detection technology
Modern thermography cameras for thermography inspection are FPA type (Focal Plane Array).
The detection system uses a two-dimensional array of detectors, in which infrared radiation from the scene of interest reaches it directly.
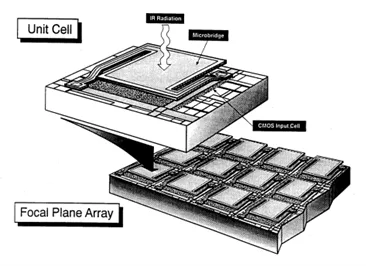
Thermography equipment – Figure 4 – Two-dimensional array of detectors called FPA, or unrefrigerated micro-bolometer.
The image refresh rate (Frame Rate) can be high and each detection element can continuously monitor the radiation emission coming from the object under inspection.
Of the components that make up the thermography chamber, the infrared detector is the most important and is a limiting factor for the performance of the thermography camera.
Detectors respond to a change in temperature with a variation in some physical property, for example, the variation in its resistance. They operate at room temperature and have a broad, uniform spectral response. The most common thermal detectors are Bolometers and thermopiles..
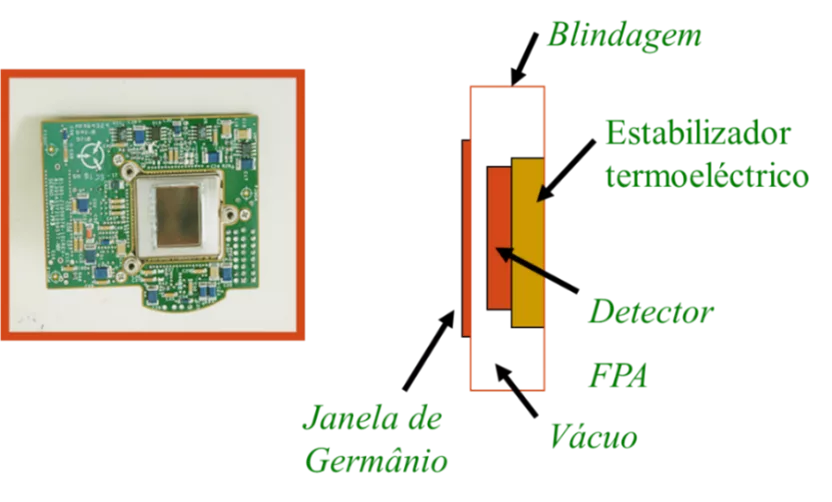
Thermography equipment – Figure 5 – Creation of unrefrigerated micro-bolometer
2.2 Thermography equipment – Spectral bands of the cameras
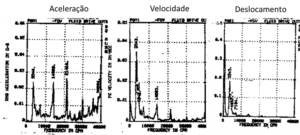
The figure shows the spectral response of some infrared detectors.
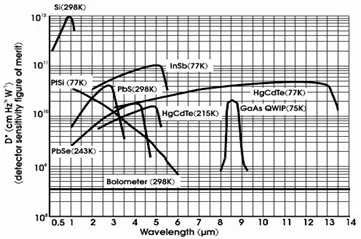
Thermography equipment – Figure 6 – Spectral response of some infrared detectors.
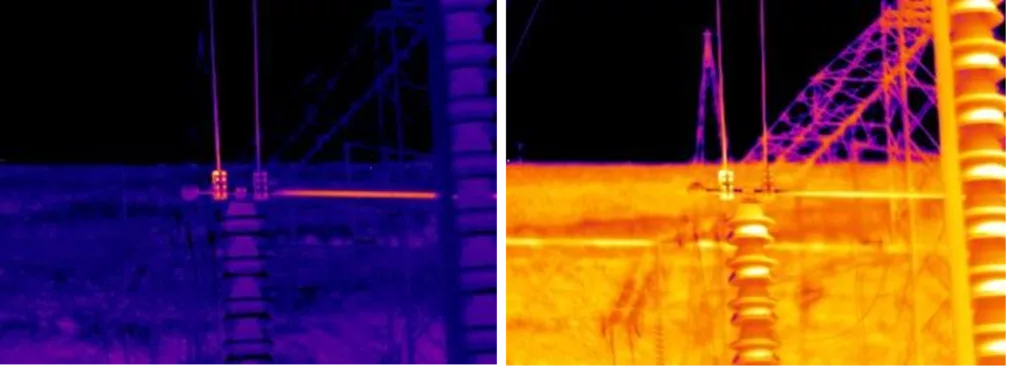
In the following figure you can see images with short wave and long wave systems.
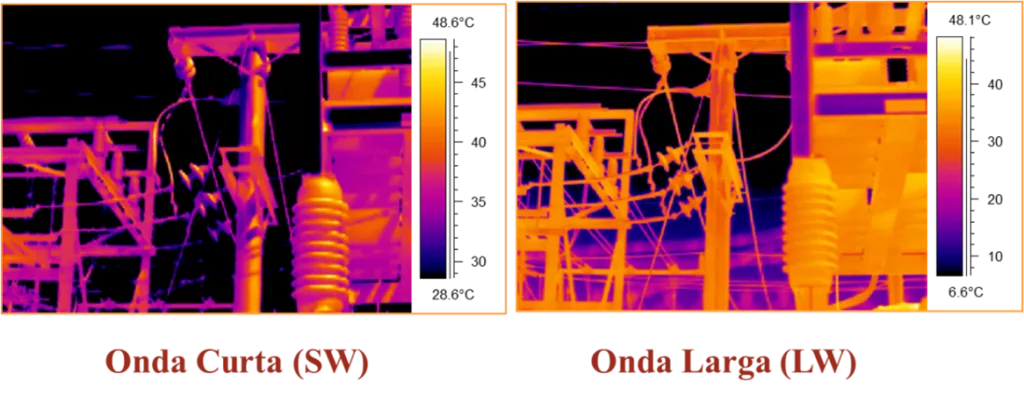
Thermography equipment – Figure 7- Imaging with shortwave and longwave systems
The wavelength ranges used for manufacturing thermography camera applicable to electrical system are from 3 µm a 5 µm and 7 µm a 14 µm, as can be seen in the figure
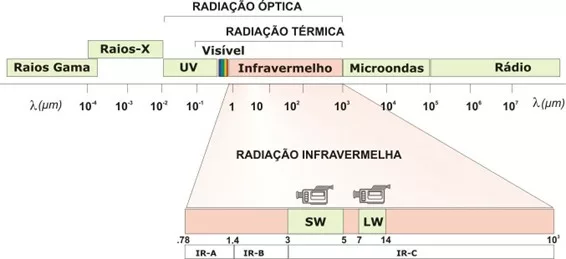
Thermography equipment – Figure 8 – Electromagnetic spectrum and spectral bands used in the manufacture of commercial thermographic cameras.
In these bands, the transmissivity of the atmosphere to infrared radiation is high.. Among them, the range of 8 a 14 µm is the most recommended because it presents even greater transmissivity. Besides that, This range is less sensitive to false high temperature points resulting from solar reflection and to temperatures typically found in electrical systems, the radiation emitted in this range is greater.
The figure shows the radiation emitted by an object at a temperature of 300 K (26,8° C) depending on the wavelength and highlights the wavelength bands 3 a 5 µm e 8 a 14 µm and their respective available energies.
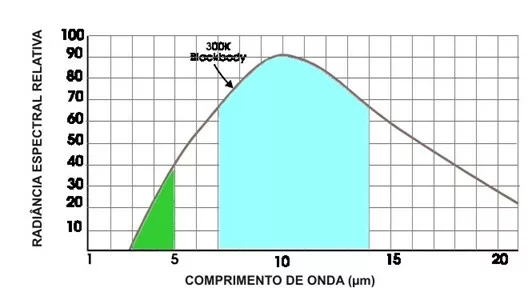
Thermography equipment – Figure 9 – Energy available in the ranges 3 a 5 µm and 8 a 14 µm for an object at a temperature of 300 K (26,8° C).
This video talks about topics related to wave compliance used by the thermography camera.
2.3 Thermography equipment – Temperature range
The temperature range is the temperature measurement range of the thermography chamber. Not case of, for example, high voltage substations, the lowest temperature found in equipment and connections will be close to the ambient temperature and the highest can reach, in extreme cases, at the melting temperature of the metals used (ex.: aluminum = 657.7° C). Despite that, the range from -20° C to 500° C, normally sold, is sufficient for inspections in substations. The reason is that the upper limit of the range is rarely (500° C) will be reached, in addition to being a very high temperature that should be avoided in electrical systems. Above this temperature, part of the radiation emitted by the object begins to enter the visible wavelength range. (Wien's displacement law), can be detected without the aid of a thermography camera. An example of this condition is shown in the figure..
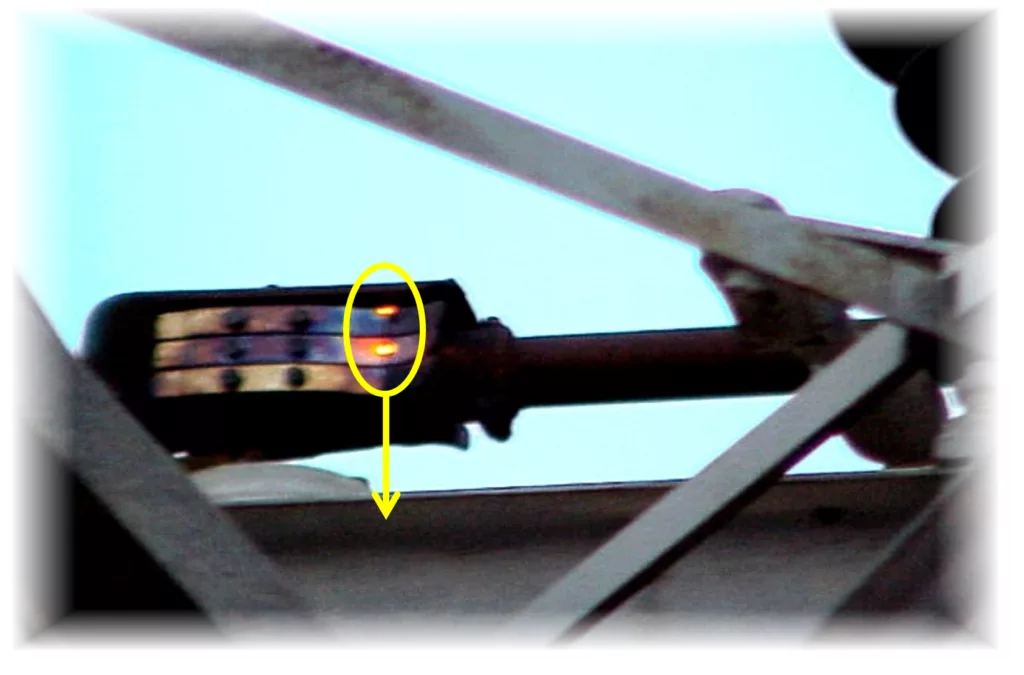
Thermography equipment – Figure 10 – Disconnector with contacts above 500° C making part of the emitted radiation visible.
2.4 Thermography equipment – Thermal sensitivity
Thermal sensitivity is the smallest temperature difference that can be detected. Depends on the properties of the optical system, detector response and system noise level. It is generally specified as the Noise Equivalent Temperature Difference (Noise Equivalent Differential Temperature – NEDT or Noise Equivalent Temperature Difference – NETD or Noise Equivalent Temperature – NET).
Thermal sensitivity is inversely proportional to the temperature at which the component is involved, meaning the system becomes noisier at low temperatures and temperature resolution decreases.
When at room temperature cai, thermography camera with spectral response in the 3 µm a 5 µm tend to have their sensitivity more impaired than a thermography camera with a spectral response of 8 µm a 14 µm.
This parameter is very important in applications where the thermal contrast is very small, such as in some insulation identification applications in buildings..
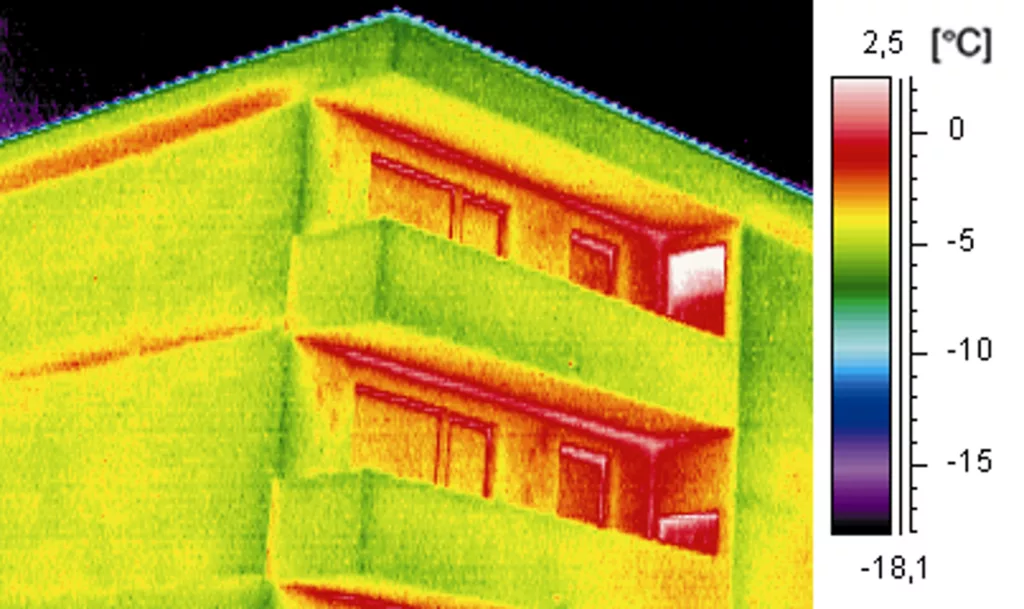
Thermography equipment – Figure 11 – Building thermal imaging
2.5 Thermography equipment – Spatial resolution
Spatial Resolution defines the smallest image detail that can be perceived. It is a function of the size of the detector and the optics of the system. Most often it is specified in radians and defined as “Instantaneous Field of View” (Instantaneous Field of View – IFOV). The IFOV is equivalent to the projection of a pixel onto the observed surface and, the sum of all IFOVs forms the Field of View (FOV), which is the total area that can be seen by the thermography camera. Generally the FOV is declared in degrees by the manufacturer.
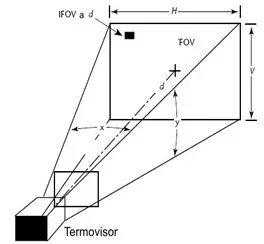
Thermography equipment – Figure 12 – Representation of the Field of View (FOV) and Instantaneous Field of View (IFOV) of a thermography camera.
The IFOV can be calculated from Equation.
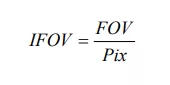
In which,
- IFOV [mrad] is the Instantaneous Field of View.
- FOV [mrad] is the Field of Vision.
- Pix is the number of pixels.
For example, a Thermography Camera with Field of View – FOV equal to 24° x 18° and 320 x 240 pixels have an IFOV equal to:
IFOVhorizontal = 24 x 17,45 / 320 = 1,3 mrad
IFOVvertical = 18 x 17,45 / 240 = 1,3 mrad
The IFOV is a parameter generally provided by manufacturers and allows, through the Equation, the calculation of the maximum distance at which an object of a given size can be detected.
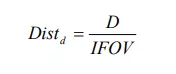
In which,
- Distd [m] is the maximum distance that an object of size D can be detected by the thermography camera.
- D [m] is the size of the object under inspection.
- IFOV [rad] is the Instantaneous Field of View.
For example, a Thermography camera with IFOV equal to 1,3 mrad can detect an object from 0,05 m x 0,05 m at a maximum distance of:
Distd = 0,05 / 1,3 x 10-3 = 38,46 m.
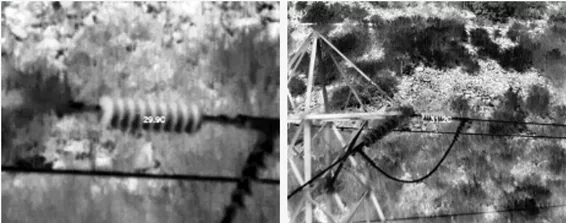
For example, in high voltage substations, whose distances from the thermography camera to the object are relatively large and the cable diameters and connection dimensions are relatively small, Instant Field of View can make the difference between locating, or not, a defect.
Below you can see a video with an example of pallication.
2.6 Thermography equipment – Measurement resolution
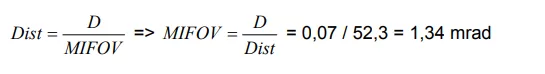
The measurement resolution defines the smallest object that can have its temperature measured, accurately, at a certain distance. Rarely stated in thermography camera manufacturer specifications, but is typically lower in spatial resolution by a factor between 2 e 4. For this reason, in many situations, the object can be detected by the thermography camera, but it will be outside your measurement resolution. When supplied by the manufacturer, it is specified in radians and defined as “Measurement Instantaneous Field of View” (Measuring Instantaneous Field of View – MIFOV ou IFOVm). Temperature readings obtained outside the limits of the measurement resolution will normally be lower than the actual reading, which can have a great influence on the analysis of the severity of the defect.
To calculate the maximum distance at which an object of a given size can have its temperature read accurately, the following equation can be used.
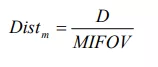
In which,
- Distm [m] is the maximum distance that an object of size D, You can have your temperature measured accurately.
- D [m] is the size of the object under inspection.
- MIFOV [rad] is the Instantaneous Field of View Measure.
Taking advantage of the previous example, in which a thermography chamber has an IFOV equal to 1,3 mrad and assuming that the measurement resolution is three times lower than the spatial resolution, an object of 0,05 m x 0,05 m can only have its temperature measured accurately at a maximum distance of:
Distm = 0,05 / 1,3 x 10⁻³ / 3= 12,8 m
Therefore, in the example presented, the same object could be detected by an IFOV thermography camera equal to 1,3 mrad at a distance of 38,46 m, but to have your temperature measured accurately it will be necessary to shorten the distance to just 12,8 m. This situation, can lead to large errors in temperature measurement and consequently in the analysis and diagnosis of the defect.
There are two alternatives to eliminate the influence of distance due to measurement resolution.
- The first is to approach the component under inspection to a distance at which the temperature can be accurately measured.. In high voltage substations this is not always possible because safe distance limits must be respected..
- The second alternative is to improve measurement resolution with the use of telescopic lenses.. Below is a situation for calculating the lens.
Assuming that the highest point, subject to defect, which can be found in high voltage substations, be the clamp that fixes the lightning cable to the tower structure and considering that the highest clamp belongs to the lightning substations 750 kV, design data from a power substation were used 750 kV, for the calculation of a telescopic lens that could meet all thermographic inspections.
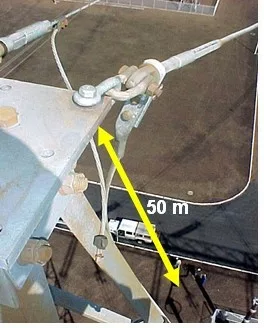
Thermography equipment – Figure 13 – Clamp that fixes the lightning cable to the tower structure.
Data:
- Distance from ground to lightning rod clamp = 50 meters
- Clamp connection diameter = 0,07 meters
Assuming that the Thermography Inspector has a height of 1,7 meters and is at a distance of 2 meters from the base of the tower results in:
Dist = (50 – 1,7)2 + 22 = 52,3 m
Logo, considering a thermography camera with the IFOV three times smaller than the MIFOV and with 320 x 240 pixels, the telescopic lens that should be used can be calculated using Eq..
FOVhorizontal = (1,34 / 3) x 320 / 17,45 = 8,2°
FOVvertical = (1,34 / 3) x 320 / 17,45 = 8,2°
A 7° x 5.3° lens can be found commercially, which would suit the case that was calculated and practically all situations found in high voltage substations.. In situations normally encountered, where the distance does not exceed 40 meters and the inspected connections have a dimension of the order of 0,1 m x 0,1 m, or greater, a 12° x 9° lens would be enough.
Telescopic lenses can improve resolution, on the other hand, they narrow the field of view of the thermography camera, as shown in Figure.
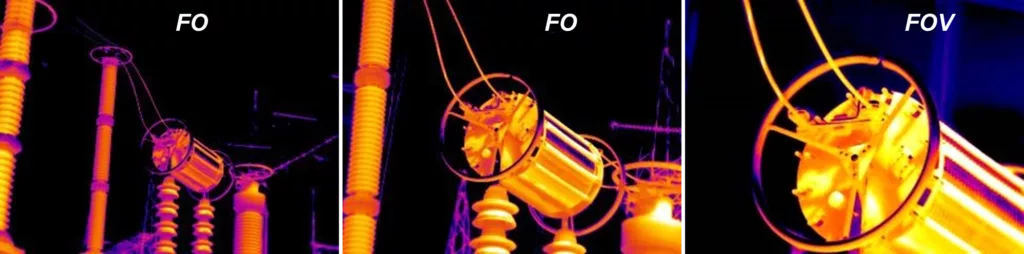
Thermography equipment – Figure 14 – Object observed from the same distance with lenses with a 24° Field of View, 12° e 7°.
2.7 Thermography equipment – The dimension of the measuring point
Another consideration is what is called the camera spot size.. A thermal camera cannot accurately measure the temperature of a single pixel for a number of reasons. In general, you need a minimum of a square of four by four pixels, but sometimes even 10 by 10 pixels. To obtain an accurate temperature measurement, make sure the camera is close enough to the target to place the camera's measuring point (this four by four pixel square) completely within the heat signature of the point requiring measurement.
Thermography equipment – Figure 15 – The importance of the size of the measuring point
2.8 Thermography equipment – Image refresh rate (Frame Rate)
The image update rate is the number of times a complete image of the observed scene is updated by the thermography camera in one second. Low image refresh rates produce a blurred image when there is relative movement between the thermography camera and the object under inspection.
Example: Thermography camera recommended for inspections in high voltage substations
Observing the characteristics mentioned above, it is recommended that a thermography camera used in inspection of high voltage substations has the specifications below:
- Be portable and lightweight so as not to cause inspector fatigue, which could limit the duration and quality of inspection in large areas.
- Fixed detection system (Focal Plane Array Detector – Focal Plane Array).
- Micro-bolometer detector, lower power consumption and detector operation at room temperature.
- Temperature range from -20°C to 500°C.
- Spectral range of 8 µm a 14 µm.
- Spatial and measurement resolution must meet the distances and dimensions of targets found in the substation. In most situations the 12° x 9° lens is sufficient.
- Thermal sensitivity of 80 mK (0,08° C).
- Image refresh rate (Frame Rate) of 60 Hz.
- Operating temperature from -15° C to 50° C.
The ability to store images and voice is also important in speeding up inspection and post-processing of data.
Below you can see the specification of a FLIR camera that meets this specification.
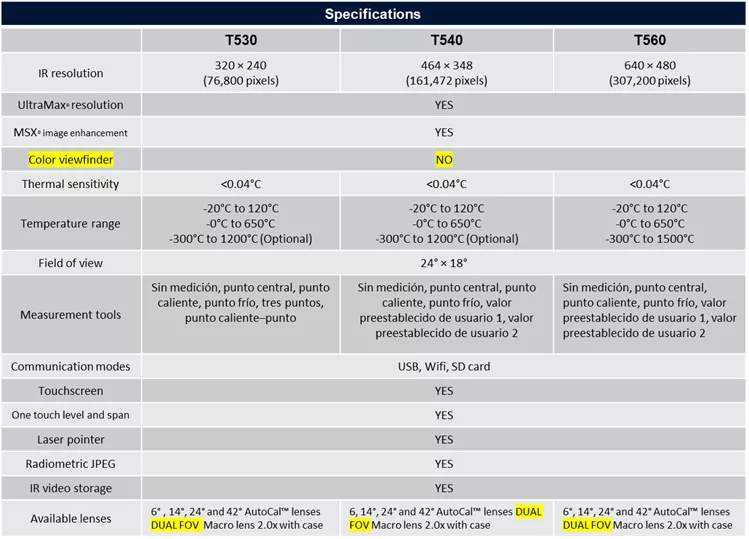
Thermography equipment – Figure 16 – FLIR Camera Model Specification
3 Thermography equipment – Use of equipment
In the figure below you can see the screen of a FLIR thermography camera model EXX.
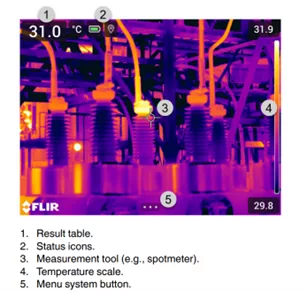
Thermography equipment – Figure 17 – Camera screen FLIR EXX
Below you can see a video about the history of thermography cameras.
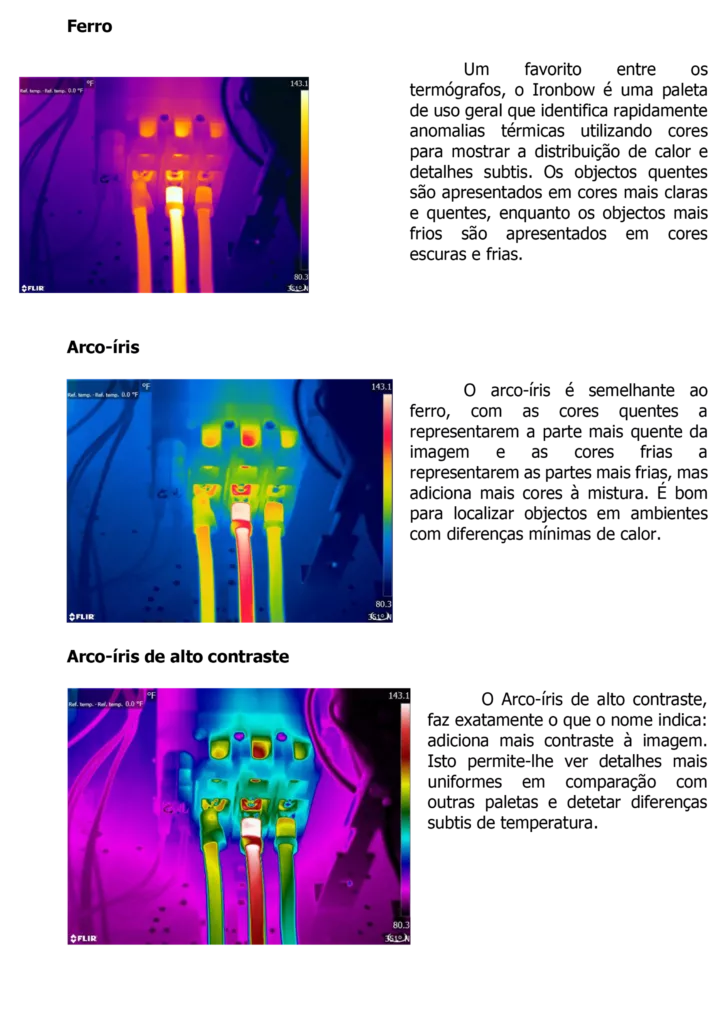
3.1 Thermography equipment – Image color palette selection
Like any digital image, thermal images are made up of pixels. In thermal imaging, each individual pixel represents a specific temperature data point. These data points are assigned a unique color or hue based on their value, which means that, as the thermal sensor detects changes in thermal energy, will express this change by adjusting the color or hue of a pixel.
Changing palettes changes the appearance of a scene and highlights key areas of a thermal image without changing any temperature data. Thermal palettes are largely a matter of user preference, but different environments or situations can benefit from one palette over another.
Here are some palette options you're likely to see:
Get hands-on experience with each available palette, is the best way to make informed decisions in the field or when generating a report.
3.2 Thermography equipment – Typical thermography camera accessories
Below you can see the typical accessories of a camera of this type.
- Infrared camera with lens,
- Small eye viewfinder,
- 2 batteries,
- Battery charger,
- Rigid carrying case,
- Correia,
- Tampa front lens,
- Power supplies,
- Printed documentation,
- SD card (8 GB),
- Cabos (USB 2.0 A para USB Type-C, USB Type-C para HDMI, USB Type-C para USB Type-C),
- License card: FLIR Thermal Studio Starter
4 Thermography equipment – At ISO 18434-1
The ISO 18434-1:2008 presents an introduction to the application of infrared thermography (IRT) monitoring and diagnosing the state of machines, where “machines” includes machine assistants, such as valves, fluid and electrically powered machines and heat exchange equipment related to machines. Besides that, IRT applications related to the evaluation of machine performance are addressed.
The ISO 18434-1:2008: introduces the terminology of infrared thermography (IRT) with regard to status monitoring and diagnostics of machines; describes the types of IRT procedures and their merits; provides guidance for establishing criteria for assessing the severity of anomalies identified by the IRT; describes the methods and requirements for performing IRT of machines, including security recommendations; provides information about data interpretation, assessment criteria and communication requirements; provides procedures for determining and compensating for reflected apparent temperature, emissivity and attenuating means.
The ISO 18434-1:2008 also covers test procedures to determine and compensate for reflected apparent temperature, emissivity and attenuating means when measuring the surface temperature of a target with a quantitative IRT camera.
5 Thermography equipment – Secure data acquisition
One of the great advantages of thermography is that inspection can be carried out without interrupting production., that is, with equipment in full working order (energized and under load), For this reason, compliance with safety standards common to the area to be inspected must be strictly observed. Special care must be taken when there is a need to open panels and approach energized equipment., situations in which the Thermography Inspector is exposed to great risks.
Another important observation is regarding the path taken. In substations, the terrain is generally uneven and the view through the thermography camera does not give a sense of depth.. British, ditches and differences in levels can cause the Thermography Inspector with the camera to fall. It is important to have prior knowledge of the path to be followed or for the thermography inspector walking with the camera to be guided by the inspection partner regarding irregularities in the terrain..
Before starting inspection work, The Person Responsible for Thermographic Inspection together with the Thermography Inspector must carry out a prior risk assessment, study and plan the activities and actions to be developed in order to meet all safety requirements applicable to the area to be inspected.
5.1 Thermography equipment – Access to equipment under inspection
The thermography inspector must carry out a sweep, with the thermography camera, in substation equipment, before even crossing the substation gate. Equipment in the process of deterioration and about to explode generally has high temperatures that can be detected by the thermography camera at relatively large distances..
5.2 Thermography equipment – Personal Protective Equipment (EPI):
Inspection in Substation Open Environments
- Helmet.
- Safety glasses.
- Safety boot with sole for electrical hazards.
- Approved clothing.
Inspection of Armored Panels and Cubicles
- Helmet.
- Safety glasses.
- Safety boot with sole for electrical hazards.
- Nomex Mesh Gloves.
- Electric arc protective suit
6 Thermography equipment – Equipment / component under inspection
The need for reliable operation, safe and continuous operation of equipment is the main reason for carrying out a thermographic inspection. The good result of the inspection depends, largely, knowledge of the functioning of the equipment under inspection and the thermal behavior of its components. Without this knowledge, It becomes difficult to determine what is within the normal range and what is a problem. Therefore, influences related to the equipment under inspection, how emissivity and load current should be discussed.
There are two different types of temperature measurements we can obtain – apparent temperature and real temperature. An apparent temperature is an uncompensated temperature reading, meaning that the correct values for the emissivity and reflected apparent temperature are left at the preset values. Normally, emissivity is defined for 1,0 or 0,95 and the reflected apparent temperature is left at 20 °C. These apparent temperature values have little or no relationship to the actual temperature of the object. They may be close, but they can easily be hundreds of degrees out of phase.
A real temperature, on the other hand, is one in which the operator compensated the emissivity, the reflected apparent temperature and – if possible – atmospheric impacts. If these factors are changed in the camera menu, On-screen temperature readings must be within the camera's accuracy specification.
6.1 Thermography equipment – Emissivity
Metals like aluminum, copper and steel are widely used in equipment due to their conductivity characteristics, aluminum being preferred in open environments due to its high resistance to atmospheric corrosion and lower cost compared to copper. However, These metals generally have a low emissivity surface, making inspection with infrared thermography difficult.
Emissivity is a surface property that determines the ability of that surface to emit radiation.. Emissivity values range from zero (perfect reflector) to one (perfect emitter – Black Body). Emissivity may vary with surface quality, with the wavelength, with the shape of the object, with temperature and viewing angle. As thermography cameras do not measure temperature directly, but rather radiation, the temperature readings provided by the thermography chamber become very dependent on this property, as shown by the equation representing the radiance emitted by an opaque object and measured by the thermography camera.
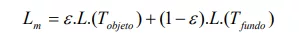
In which,
- Lm [W.m-2.sr-1] is the radiance measured by the thermography camera.
- e.L.( Tobject) [W.m-2.sr-1] is the radiance emitted by the object.
- (1-e).L.( Tbottom) [W.m-2.sr-1] is the radiance reflected by the object.
The effect of emissivity on the radiation emitted by a surface is detected by a thermography camera, and can be seen in the figure, in which a test carried out in a laboratory shows the surface of an iron with the emissivity of some areas altered by the change in the surface material or its state (polished, dirty or rough). Note that despite the entire surface being at the same temperature, areas with higher emissivity appear in the thermographic image with higher temperature (lighter areas).

Thermography equipment – Figure 18 – Visible and thermal image of the surface of an iron with different emissivities.
The figure shows a real situation of a connection with high temperature and low emissivity, in which an increase in the emissivity of a small area can be observed with the application of an identification tape. It's important to remember, that the entire demarcated region is at the same temperature.
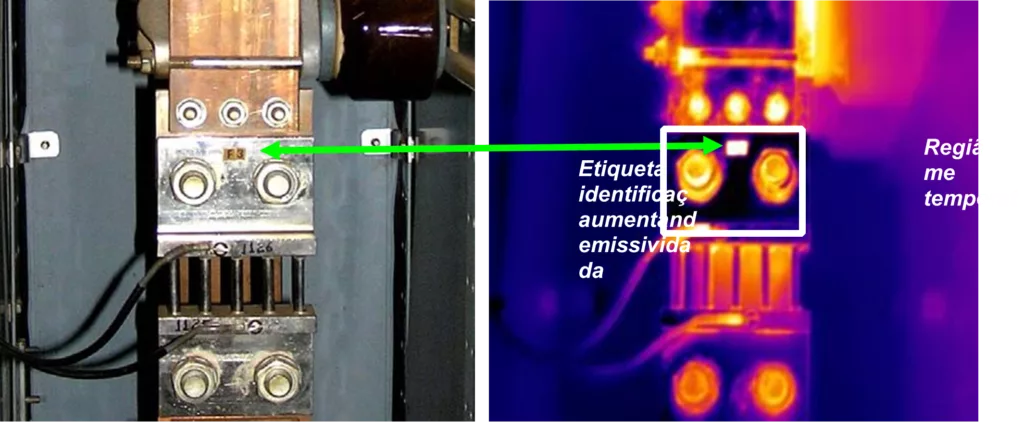
Thermography equipment – Figure 19 – Connection with high temperature and low emissivity
As can be seen in the figures above, emissivity is a factor that must be strongly considered in inspections. Although thermography cameras have an emissivity adjustment to compensate for this influence, Sometimes there is great difficulty in determining the correct emissivity of the various equipment and connections involved. Besides that, The emissivity value can vary greatly depending on factors such as dirt, oxidation, corrosion, etc. Therefore, The best way to reduce this influence would be to increase the emissivity of the inspected components to a value as close as possible to unity.
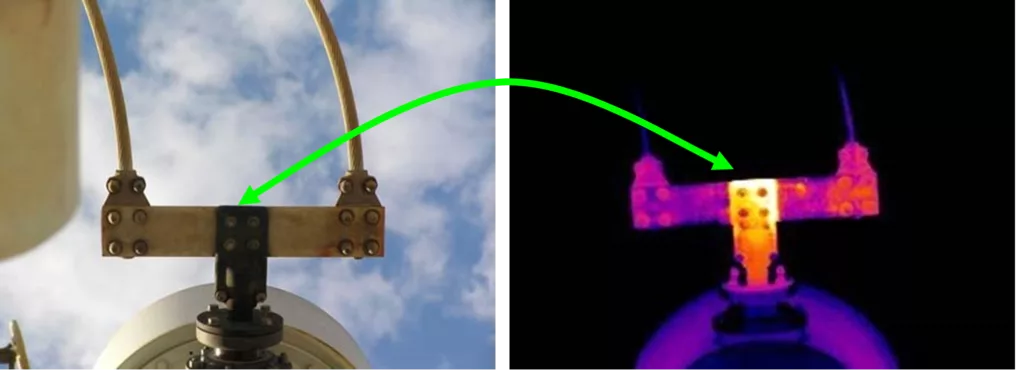
Like this, the inspector must seek to measure the temperature in areas of the components where there are cavities, taking advantage of the increase in emissivity due to the “cavity effect” or looking for areas with oxidation, corrosion or dirt that also cause an increase in emissivity and consequently in the accuracy of the measurement carried out by a thermography camera.
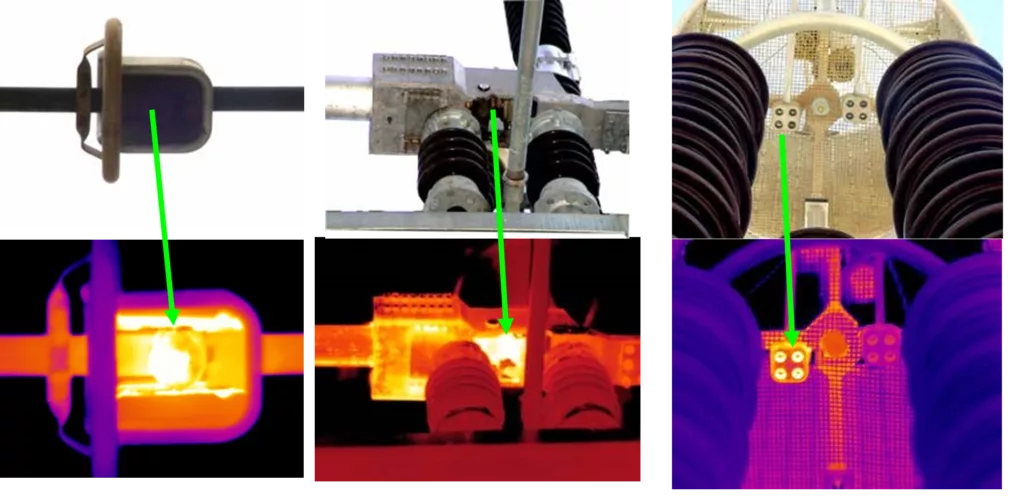
Thermography equipment – Figure 20 – Equipment and connections presenting greater emissivity in cavity areas.
Thermography equipment – Figure 21 – Connection presenting greater emissivity in oxidized areas.
Below are the emissivities of some materials.
Table I – Emissivities of some materials.
| Material | Emissivity |
| Burnt toast | 1.0 |
| Asphalt | 0,95 |
| Ferro (rusty) | 0,7 |
| Water | 0,93 |
| Beef fat | 0,78 |
Below you can see a video on this topic..
6.2 Thermography equipment – Experimental determination of emissivity
Below are two ways to experimentally determine the emissivity of a material:
First
- Determine your temperature with a contact thermometer;
- Adjust the chamber emissivity until the correct value is measured.
Second
- Stick a sticky tape, with known emissivity, on the material where you are going to measure;
- Measure the temperature on the tape with the camera;
- Point the camera at the adjacent material and adjust the emissivity until it reads the correct value.
6.3 Thermography equipment – Ambient temperature reflected
The reflected apparent temperature (often abbreviated as Trefl) is also a measured value that is then entered into the camera menu. As the name indicates, is an apparent temperature, therefore measure it with the emissivity value defined for 1,0. Then, place a reflective material next to the object in question and obtain an average temperature of the reflective material. Enter this value into the reflected temperature area of the camera menu and proceed to measure the object of interest.
6.4 Thermography equipment – Viewing angle
The emissivity of a surface decreases as the viewing angle increases relative to its normal, and accurate temperature measurements can only be made at angles below 30°. From 30° to 60° a small error is introduced and from 60° the error becomes very large, as shown in the graph in the figure.
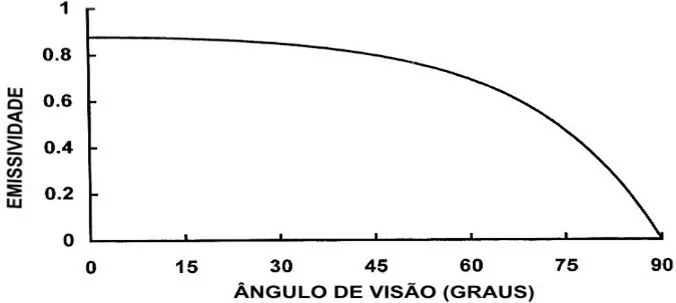
Thermography equipment – Figure 22 – Emissivity depending on viewing angle.
For example, In high voltage substations, most of the components to be inspected are located at a height higher than that of the thermography inspector and frequently the temperature reading is taken at an angle different from the normal line. To reduce and even eliminate errors due to viewing angle, The thermography inspector must seek the most perpendicular view possible with the surface of the component under inspection, as shown in the figure

Thermography equipment – Figure 23 – The thermography inspector must seek the most perpendicular view possible with the surface of the component under inspection.
6.5 Thermography equipment – Component load under inspection
The heat generated in a faulty connection depends on the intensity of the current passing through it., where the power dissipated is directly proportional to the square of the current (P=I2.R) and the temperature, despite increasing with the current, follows a more complex pattern, between a linear and geometric rate.
During its operation, the equipment may suffer from frequent load variations that may influence the inspection result, Therefore, the load current is another factor that must be considered in thermographic inspections of electrical systems.
The current flowing through the component under inspection is not responsible for errors in temperature measurement, Yes, she can interfere, in the analysis and diagnosis of the defect. For example, in cases where the current is low, certain flaws may not be noticed or serious defects may be underestimated.
To eliminate the influence of load current on thermographic inspection, The ideal would be to carry out the inspection with the equipment operating at full load, However, this is not always possible due to the variation in circulating current depending on the load required by the system.. On occasions when thermographic inspection is being carried out with the load current below 100% of the maximum, Most of the works reviewed here guide the use of an equation, with which we intend to predict the temperature of the component when the current is maximum, providing more information for a better analysis of the equipment under inspection. The generally recommended equation is:

In which,
∆TC [°C] is the rise in temperature above a reference temperature when the current reaches the maximum value Imax.
∆Tm [°C] is the rise in temperature above a reference temperature when measured with current Im.
Imax [A] is the maximum current allowed.
Im [A] is the circulating current at the time of measurement.
Take the example of the following figure.
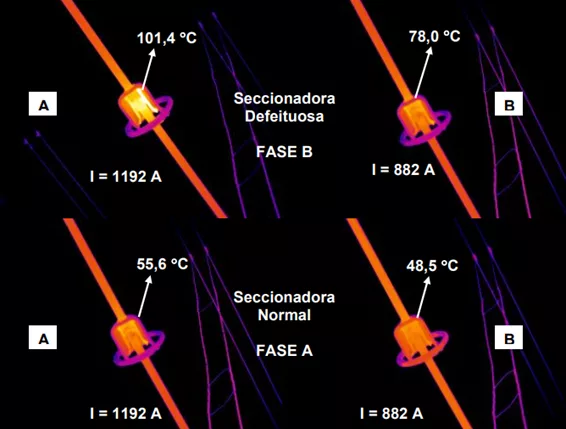
Thermography equipment – Figure 24 – Thermograms showing the effect of current on the temperature of a disconnector with high contact resistance and on the temperature of a normal disconnector.
Applying the previous equation to the real example in the figure and assuming that the inspection was carried out at the instant when the current was 882 A, the calculation of the temperature rise above the reference temperature will be:
∆TC = 53,9° C
Result 17,7% greater than the real value:
∆T = 101,4 – 55,6 = 45,8° C
Still regarding the effect of current on temperature, It is important to note that there is thermal inertia, that is, After an increase or decrease in current, a period is necessary for the temperature to stabilize.
For example, In the case of most electrical substation equipment, the circulating current varies constantly, It is possible that in certain situations the current at the time of inspection may be completely different from the current at the previous moment and the use of the previous equation, which only takes into account the moment current, would lead to considerable errors, since it does not consider the thermal response of the component under inspection.
6.6 Thermography equipment – Environmental conditions
The environment in which thermographic inspection is carried out plays an important role in the results obtained. Atmospheric transmissivity, the radiation emitted by the sun, at room temperature, the wind, Rain and relative humidity can affect the thermal distribution of the components under inspection in different ways, as well as the amount of infrared radiation that reaches the thermography chamber.
6.6.1. Thermography equipment – Atmospheric transmissivity
Atmospheric transmissivity varies with temperature, relative air humidity and the amount of particles suspended in the air (dust, pollution, fog and mist).
The atmosphere can act on the radiation emitted by objects through four phenomena:
- Absorption
- Dispersal
- Emission
- Turbulence
6.6.2 Thermography equipment – Absorption
Absorption causes radiation attenuation and can be of two types:
- Molecular absorption.
- Aerosol absorption.
Because of the many minor components of the atmosphere, Molecular absorption is a much more significant source of attenuation of radiation propagation than aerosol absorption.
6.6.3 Thermography equipment – Dispersal
The phenomenon of dispersion causes the redistribution of the incident flow in all directions of propagation and decreases the flow in the original direction. There are two distinct types of atmospheric scattering, molecular dispersion (Rayleigh) and aerosol dispersion (Mie). Aerosol scattering affects atmospheric transmissivity much more strongly than molecular scattering.. Usually, the scattering effect decreases as the wavelength of radiation propagation increases. Therefore, Transmissivity in smoke is much higher in the infrared range. 8 a 14 µm than for the range 3 µm a 5 µm.
6.6.4 Thermography equipment – Turbulence
The phenomenon of turbulence is caused by irregular air movements. It appears when air molecules of slightly different temperatures are mixed by wind and convection. From an optical point of view, such movement means the random fluctuation of the refractive index of the atmosphere, which results in an imperfection in the image generated by the optical system. For example, in substation inspections, whose component-thermography chamber distances rarely exceed 50 meters, the effect of this phenomenon can be neglected.
6.7.5 Thermography equipment – Earth's atmosphere
The Earth's atmosphere is a mixture of many gases.
O Azoto (N2) and oxygen (O2) are the main components in the composition of the atmosphere and the concentration of other gases is much lower, however, two of them play an important role in the transmissivity of infrared radiation:
- The water vapor (H2O) which depends a lot on altitude, season, geographic location, time of day, weather conditions and is subject to large fluctuations.
- Carbon Dioxide (CO2) which exists in greater concentration in industrial and vegetation areas than in oceans and deserts.
The figure graphically shows atmospheric transmissivity as a function of wavelength, as well as areas of greater absorption of gases and the so-called infrared “windows” of 3 a 5 µm and 8 a 14 µm.
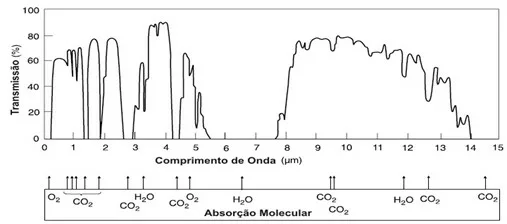
Thermography equipment – Figure 25 – Transmission from the atmosphere to a distance of 1,8 km at sea level with 17 mm of rain precipitation.
Atmospheric transmissivity is a function of wavelength and distance, and the greater the component-thermography chamber distance, the lower the atmospheric transmissivity. The following two figures represent atmospheric transmissivity for the wavelength range typically used by thermography cameras and for distances typically encountered in inspections of high voltage substations..

Thermography equipment – Figure 26 – Atmospheric transmissivity for a distance of 10 m.
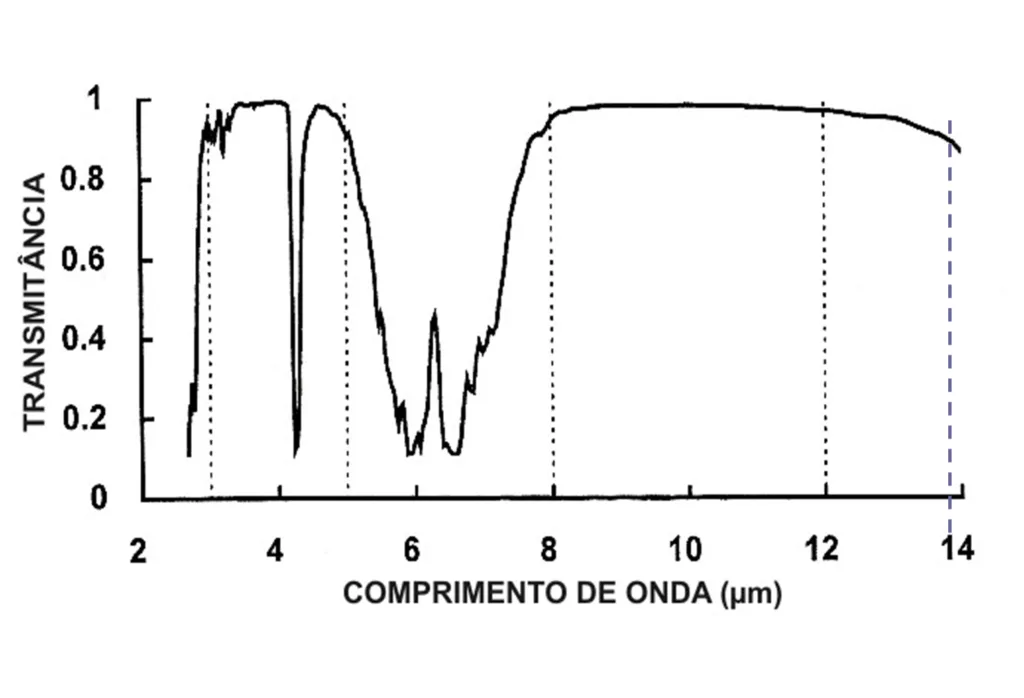
Thermography equipment – Figure 27 – Atmospheric transmissivity for a distance of 50 m.
It can be seen from the figures that atmospheric attenuation is low for distances below 50 meters in the so-called infrared “windows”.
7 Thermography equipment – Climatic Factors
7.1 Thermography equipment – Solar radiation
Most of the equipment and components of an unhoused outdoor substation are exposed to solar radiation. It can influence thermographic inspection in two ways:
- By direct solar radiation
- By solar reflection
7.1.1 Thermography equipment – Direct solar radiation
Solar radiation affects the components of a substation in general, increasing their temperatures and making it difficult to distinguish, by thermography, of a defective component and a normal one, as shown in Figure. This is particularly true when the defective component has a small temperature difference with respect to the normal component.. Besides that, Solar radiation can raise the temperature of defective components, which are already at critical temperatures, causing them to progress more quickly to failure.
Thermography equipment – Figure 28 – Thermograms of a faulty connection and a normal connection – (a) No solar radiation (22:51 h) – (b) With solar radiation (17:26 h)
All surfaces exposed to solar radiation and which have high absorption in the solar spectrum region tend to heat up.
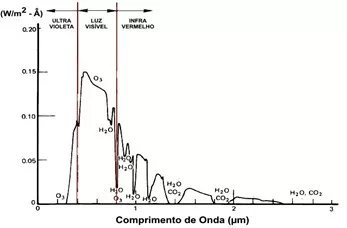
Thermography equipment – Figure 29 – Energy from the Sun typically seen through Earth’s atmosphere.
The temperature will depend on the relationship between absorption at the sun's wavelength and emission at the infrared wavelength., range in which most of the absorbed energy will be emitted. The greater this relationship, greater surface heating due to exposure to the Sun.
The level of influence of solar radiation depends on the season of the year, summer being the period of maximum exposure.
It is recommended that thermographic inspection be carried out at times free from solar radiation, that is, between sunset and the early hours of the day, or on days with cloudy skies. However, must be taken into account, for the purpose of analyzing and diagnosing defects found during inspection, that temperatures measured in the period free from solar radiation may increase during the day due to exposure to the Sun. The figure below clearly shows the influence of solar radiation on equipment in a high voltage substation.

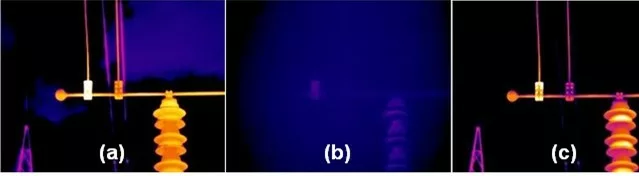
Thermography equipment – Figure 30 – Thermograms of a Current Transformer, under the sun, obtained from three different positions. (a) A favor do Sol – (b) Intermediate between for and against the Sun – (c) Against the Sun.
If it is necessary to carry out thermographic inspection on days with high solar load, the effect of charging can be minimized by taking a temperature reading on the surface of the component opposite the sun, This can be seen in Figure 56 – (c). It is important to remember that defective components, with small temperature differences compared to normal components, can go unnoticed.
7.1.2 Thermography equipment – Reflected solar radiation
Metals used in substations typically have very low emissivity, for both solar radiation and infrared radiation, especially when new and polished. As the transmissivity of these metals is zero at these wavelengths, the reflectance is high. Therefore, the radiation that reaches the thermography camera detector can be, for the most part, from another nearby heat source or even from solar radiation reflected by the surface of the component.
7.2 Thermography equipment – Rain and humidity
Humidity is the concentration of water vapor in the air. Like any other substance, air has an absorption limit, This limit is called dew point. Above the dew point limit, excess water precipitates in the form of mist or small drops of water. (rain). The amount of water that the air absorbs before reaching saturation depends on temperature and increases progressively with it., as shown in the graph in the figure.
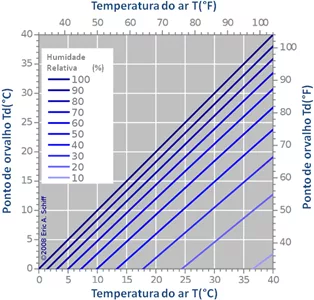
Thermography equipment – Figure 31 – Dew point of water in the air as a function of temperature (at sea level).
High air humidity affects thermographic inspection in two ways:
- Cooling the component, making detection difficult, analysis and diagnosis of the defect.
- Mitigating infrared radiation, emitted by the component under inspection, that reaches the thermography camera detector.
7.3 Thermography equipment – Cooling
In environments with high humidity due to atmospheric precipitation of water, the high thermal conductivity of water helps dissipate the heat produced and evaporative cooling reinforces the cooling process. The result is a strong reduction in the temperature of the component under inspection, as well as the entire scene involved.
Thermography equipment – Figure 32 – Effect of rain on the temperature of connections
- (a) One hour before the rain starts –
- (b) During the rain –
- (c) An hour after the rain stopped
7.4 Thermography equipment – Mitigation
Water vapor present in the atmosphere causes the absorption of infrared radiation, reducing atmospheric transmissivity. When the concentration of water in the atmosphere increases, transmissivity decreases. In cases of fog, the greater attenuation is caused by the scattering of radiation due to aerosols (non-ar suspended particles). The scattering amplitude depends on the relationship of particle diameter and wavelength. When this relationship is large, the dispersion is significant, otherwise the dispersion is minimal. The graph in the figure shows the dispersion coefficient as a function of wavelength for different fog intensities (different particle sizes) and for a distance of 1 km.

Thermography equipment – Figure 33 – Dispersion as a function of wavelength for different fog intensities (fog) and for a distance of 1 Km.
In thermographic inspections of high voltage substations, whose distances hardly exceed 50 meters, attenuation due to scattering is minimal.
To reduce the influence of rain and humidity on thermographic inspection results, It is recommended not to carry out thermographic inspections in the rain, fog or very high relative humidity. Thermographic inspections, immediately after rain occurs, should be avoided due to the strong reduction in the temperature of the component under inspection. It is advisable for the inspection to begin with, no minimum, an hour after the rain stopped.
7.5 Thermography equipment – Vento
Wind is considered as moving air. Result of displacement of air masses, derived from the effects of differences in atmospheric pressure between two distinct regions, which have thermal origin and are directly related to solar radiation and the heating processes of air masses.
In thermographic inspections carried out in open environments, wind plays an important role in the outcome of the inspection. Winds with relatively low speed can considerably affect the temperature of the inspected object. Serious defects may have their temperature reduced and appear, in a thermal image, a minor problem. On the other hand, defects in early stages, showing small increases in temperature, may simply not be detected by inspection. The figure shows an example in which the two situations described occur.
Thermography equipment – Figure 34 – Effect of wind on the temperature of an oil circuit breaker.
- (a) With wind speed equal to 0 km/h
- (b) With moderate wind speed.
The greatest reductions in component temperature occur at low wind speeds, continuing to fall at high speeds, but at a much lower rate.
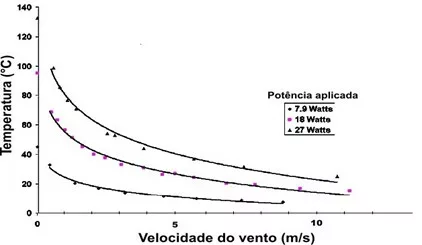
Thermography equipment – Figure 35 – Reduction in component temperature depending on wind speed.
The effect of wind on the temperature of the component under inspection depends on several factors. Among them, the power being dissipated by the component in question, the velocity, wind direction and duration, the area and shape of the component and the structures and buildings that are around it.
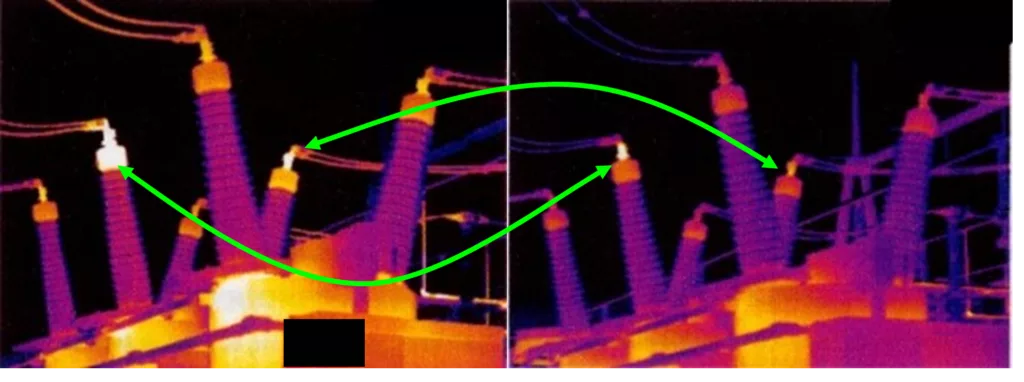
In the images in the figure, you can see the strong effect of wind on the temperature of a faulty connection and a normal one, even at low speeds.
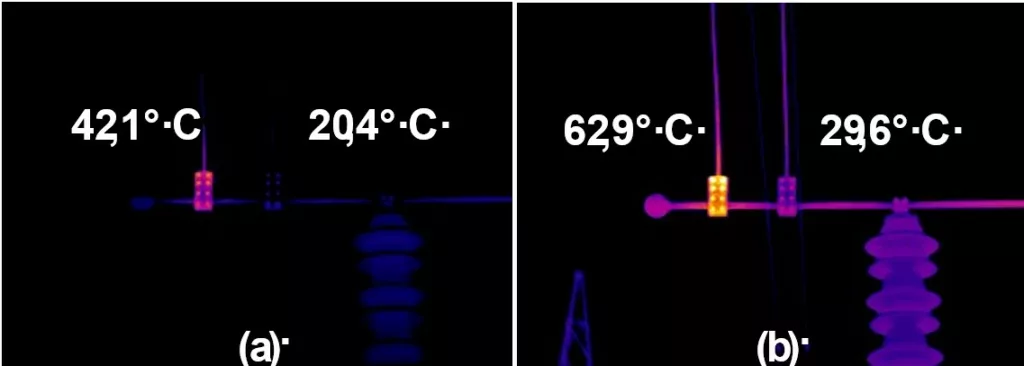
Thermography equipment – Figure 36 – Effect of wind on the temperature of a faulty and normal connection.
- (a) With wind speed of 6,4 km/h (5:55 h)
- (b) With wind speed equal to 0 km/h (9:14 h).
The effect of wind on thermographic inspection is important and often difficult to avoid.. Temperature correction factors based on wind speed for open environments are impractical. Therefore, It remains for the thermography inspector to be aware of the influence of wind on the temperature of the component under inspection and try to carry out temperature measurements in the lowest possible wind speed ranges..
To help analyze and diagnose thermal images, It is recommended to take a temperature reading, when possible, on the surface of the component opposite the wind incidence, so that its effect is minimized.
7.6 Thermography equipment – Room temperature
Thermographic inspections in open environments must take the ambient temperature into account, especially in the extremes of summer and winter. Considering other stable influences, an increase in ambient temperature will result in an increase in component temperature, therefore failures have a greater chance of occurring during hot days. On the other hand, defects that would commonly show a slight increase in temperature, on cold days they may simply not be detected.
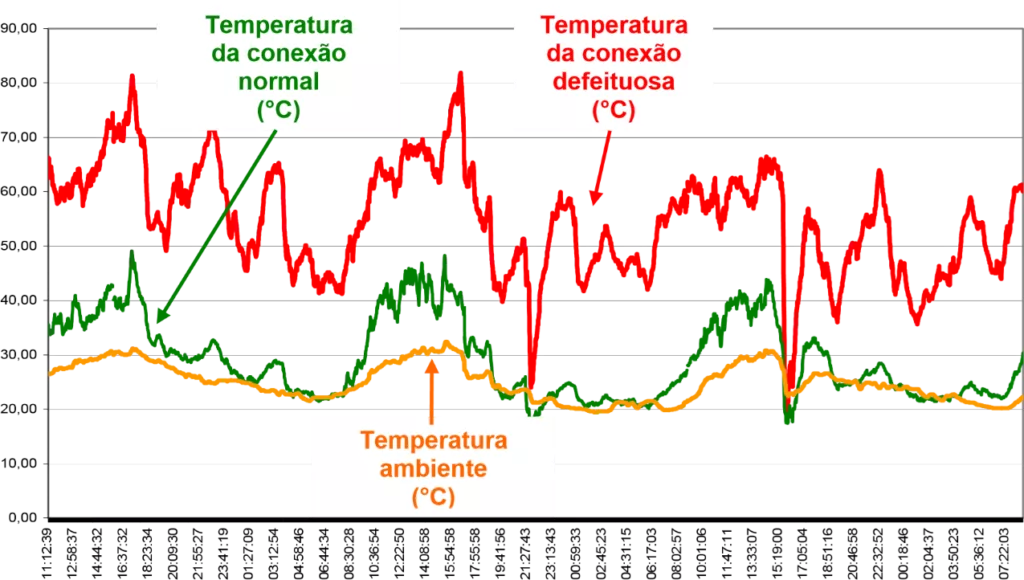
Thermography equipment – Figure 37 – Variation in the temperature of a faulty connection and a normal connection and in the ambient temperature over a period of approximately 70 hours.
Whenever possible, inspection must be carried out under the worst conditions. If the inspection frequency is annual, the chosen period of the year must be the hottest, that is, during the summer.
Below you can see a video showing the care you need to take when taking measurements abroad..
7.7 Thermography equipment – Room temperature reflected
Below you can see a video about determining the reflected ambient temperature.
8 Thermography equipment – Inspection procedure
The reference standard for this activity is the:
ISO 18434-1:2008 Condition monitoring and diagnostics of machines — Thermography — Part 1: General procedures
Given all the influences and limitations of the application of thermography mentioned,, It is essential that an inspection procedure is defined.
In this example, the case of a high voltage substation is used..
Scope
Inspections using infrared thermography in High Voltage Substations located in open environments.
Goals
Define procedures for carrying out inspections using infrared thermography in High Voltage Substations located in open environments, as well as providing a model for recording the thermal anomalies found and providing criteria for evaluating the severity of thermal anomalies.
- Carry out, in conjunction with the Thermography Inspector, a prior risk assessment. Study and plan the activities and actions to be developed in order to meet all safety requirements applicable to the area to be inspected.
- Provide the Thermography Inspector with authorization to work in the area to be inspected.
Thermographic Inspection
Prerequisites
- Carry out the inspection with, no minimum, a Thermography Inspector and a worker authorized to work in electrical installations.
- Obtain authorization to work in the area to be inspected.
- Open specific work order for date and location, signed by the person responsible for the area to be inspected.
Equipment and Materials Required for Inspection
- Thermography Camera.
- Thermo-hygro-anemometer.
- Digital camera.
- High Power Flashlight (night inspections).
- Radio for communication with the operation center.
Obs.: The thermal camera and thermo-hygro-anemometer must be calibrated within the expiration date.
Precautions
- Observe the safety standards common to the area to be inspected.
- Observe the specifications and precautions described in the manufacturer's manual for the equipment used.
recommendations
The recommendations below must be observed, although inspection may be carried out on occasions when it is difficult to achieve all desired conditions. However, The thermography inspector must keep in mind that such an option can considerably influence the results obtained.
- Avoid daytime thermographic inspections to avoid influences from solar radiation.
- Avoid inspections with wind speeds above 20 km/h.
- Avoid inspections with current below 40% of the historical current.
- Do not carry out inspections with relative air humidity above 90%.
- After rain occurs, wait, no minimum, 1 time to start inspection.
- To obtain temperature readings, equipment under inspection must be on charge in the period prior to the inspection of, at least one hour, so that thermal stability can be achieved.
- The angle between the thermography camera lens and the inspected point must be as perpendicular as possible to avoid reducing emissivity due to very acute observation angles..
Detailed Procedure
- Inspecting equipment abroad, start inspection, preferably, one hour after sunset. In need of daytime inspections, it is recommended that they be carried out preferably up to a maximum of 2 hours after sunrise or on cloudy days to avoid solar radiation.
- Adapt the thermography camera, the appropriate lens for the distances and dimensions of the points to be inspected, not forgetting that these lenses have a minimum focal length. In most situations found in substations a 12° field of view lens is sufficient.
- Adjust the emissivity of the thermography camera to 0.75.
- Carry out the inspection according to the pre-established Inspection Route.
- When locating a point with a probable anomaly: get as close as possible (always respecting safe distances) to get the image and temperature reading;
- Adjust camera focus for best condition, in order to avoid reading errors;
- Adjust the temperature range of the chamber to the object being inspected, the maximum and minimum level to be displayed in the image.
- Try to measure the temperature at the highest emissivity points of the object under inspection, that is, in painted areas or with cavities, or attacked by corrosion or oxidation or pollution;
- Carry out and record wind speed measurements, ambient temperature and relative humidity;
- Obtain and record the average current at the point in the one hour period prior to the inspection;
- Identify and record point data, as license plate data, phase or circuit no. and voltage range;
- Obtain a thermal and visible image of the anomaly point, as well as the image and temperature reading of the Reference Point.
- At the end of the inspection, report to the Control Room.
- For each anomaly found:
- Answer item questions 4.5 to determine the measures to be adopted.
- Complete the report presented in the item 4.5 and inform the department responsible for maintenance to schedule the repair date based on the answers to the questions in the item 4.5.
- After the maintenance team has carried out the repair, Another inspection must be carried out to ensure that the anomalies have been remedied. If the point is still having problems, another report must be issued, with the observation that the point has already been reported previously.
Periodicity
The frequency of thermographic inspection in high voltage substations must be defined according to the particularities of each installation, but it must be taken into account that inspections carried out at short intervals favor the detection of thermal anomalies in the early stages, enabling scheduled maintenance, while, Long-term inspections may find anomalies at critical stages requiring urgent maintenance.
Below you can watch a video on preparing inspection reports.