Equilibragem no local
This article referred to some concepts associated with equilibragem no local and presented some practical cases of application.
1 Equilibragem no local – general concepts
1.1 Introduction
The imbalance of the rotors is a problem that becomes all the more important the greater the power and speed of the machines. It is one of the most frequent causes of vibration in rotating equipment. The balancing becomes necessary to prevent the appearance of cracks, avoid excessive loads on the bearings and extend the life of equipment.
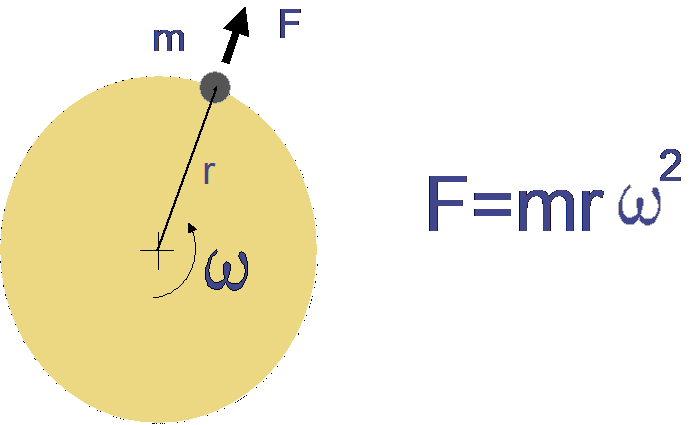
Figure 1 - Balancing on site - the centrifugal force
The balancing is the operation by which improves the mass distribution of a rotor, so that in operation, do not appear excessive centrifugal forces.
Then describes how they should measure the imbalance of a rotor and to determine whether it needs balancing. Also described balancing procedures.
1. 2 The imbalance in the frequency spectrum
No Spectrum Frequency, The imbalance has the effect of causing the component to increase the rotation speed. This is because of the unbalanced mass accompany the rotor in its rotation and therefore thus express 1xRPM.
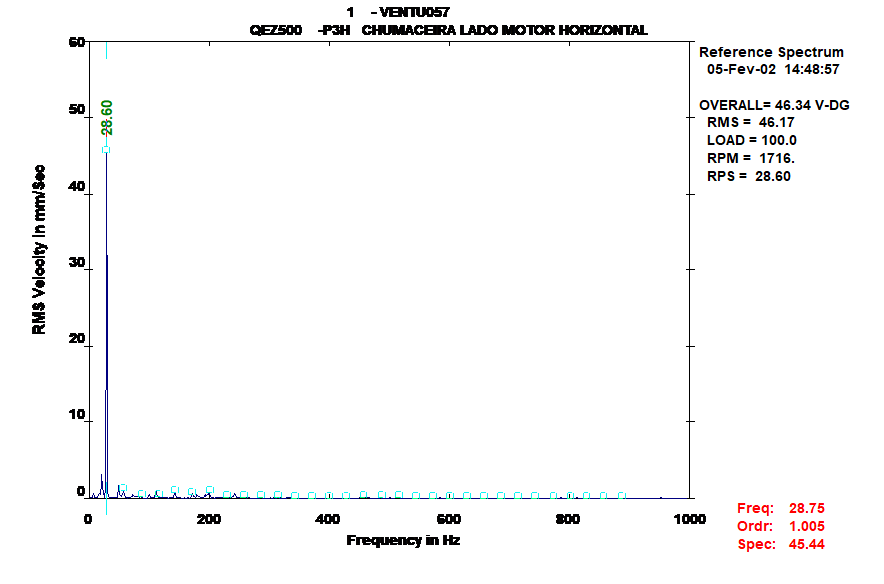
Figure 2 - balancing on site - the frequency spectrum obtained with a vibration analyzer
To identify the cause of excessive vibration, is very important to make a Vibration Analysis, before you start balancing operation.
The illustration shows a spectrum, at speed, where the problem is an imbalance, as indicated from the peak to the rotational speed. If the rotor is unbalanced, or 1xRPM normally dominate peak or spectrum. The components of the 2x and 3x RPM also often notice.
In the following figure, also see the reduction of vibrations, after balancing, for approximately 1/5 the original level.
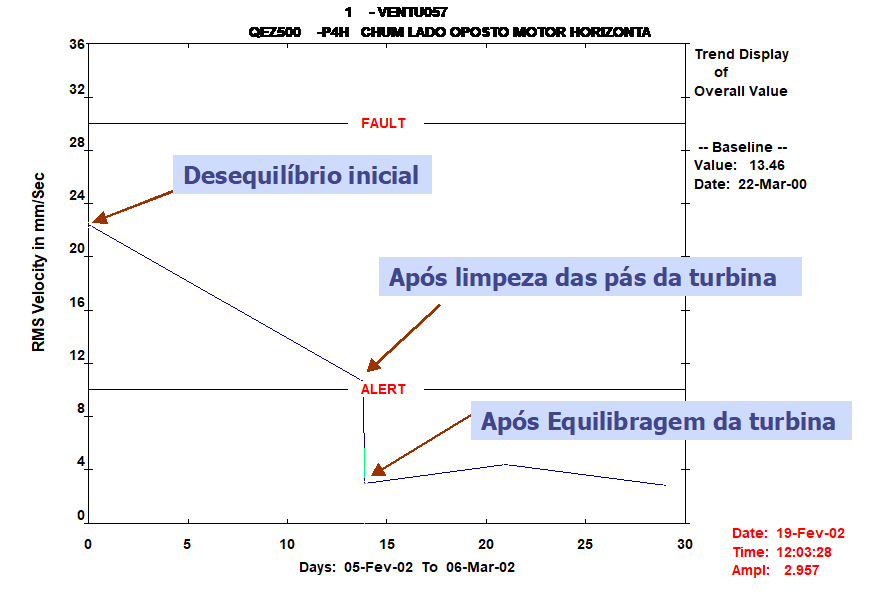
Figure 3 - Balancing on site - the result of balancing
To understand how to correct the imbalance, It will be going on to describe the forces involved and terminology according to ISO 1940.
According to this standard, may occur three types of imbalance:
- Static (or strength)
- Moment (or binary)
- Dynamic
1. 3 The static imbalance
The simplest case occurs an unbalance disk mass M, symmetrical around its axis of rotation. This is the case of many fans. If a small mass m (grams) is fixed on the disk at a distance r (mm) shaft, it is unbalanced. The location of imbalance is often determined, the shaft supporting two blades. For this reason, It is often called static imbalance (or plane).
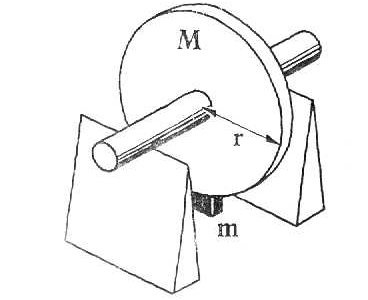
Figure 4 - balancing on site - static imbalance
The centrifugal force, generated by the mass when the drive wheel speed , It is given by:

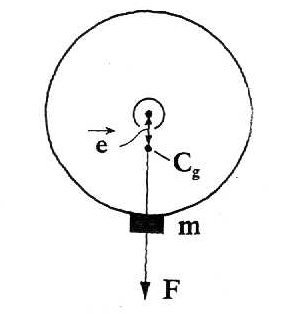
Figure 5 - balancing on site - the centrifugal force in static imbalance
This force is equivalent to the force generated by a small eccentricity e, between the center of gravity of the disk and the axis of rotation:

The imbalance, The, It is defined by the formula:
U=m.r
The specific imbalance is found by dividing the balance of the value of rotor mass.

He:


it follows that:

The static imbalance is defined as an eccentricity of the center of gravity, caused by a point mass at a given radius from the axis of rotation. To reset the center of gravity in the center of rotation, a mass equal value is required, placed 180 grades as opposed to mass imbalance and the same radius, or alternatively remove the unbalancing mass. This, in practice, It means that a static imbalance is corrected in a plane.
Day to day, many are rotors that can be considered as a disc. This is the case of many fans or millstones. It is normal to consider the rotors whose diameter is 7 a 10 times greater than its width, as disks.
1. 4 Equilibragem no local – Unbalance moment
Often there rotors wherein the diameter is not 7 a 10 times greater than its width, as in the case of electric motors. This gives rise to imbalances or dynamic time.

Figure 6 - balancing on site - centrifugal force at the time of imbalance
In the case of a cylinder, as shown in Figure, you can have two equal masses, placed symmetrically about the center of gravity. The rotor is balanced statically, that is, its center of gravity is not eccentric. Yet, when you begin to run, the two masses provoke forces that generate a binary. This causes strong vibrations. The imbalance can be corrected, measuring the vibrations with the machine in progress and then putting pasta on two planes.
1.5 Equilibragem no local – dynamic imbalance
Normally, a rotor imbalance is a combination of a static imbalance with a time, that is, It is a dynamic imbalance. To correct the imbalance, it is necessary to measure the vibrations with the shaft rotating masses and then put in two planes.

Figure 7 - balancing on site - the centrifugal force in the dynamic imbalance
1.6 ISO standard 21940-11 ISO standard
ISO standard. ISO standard, ISO standard. ISO standard. ISO standard, ISO standard: ISO standard.
ISO standard “ISO 21940-11:2016 ISO standard – ISO standard 11: ISO standard”. ISO standard. Further on we will see how using this degree together with a graph determines the acceptable imbalance.
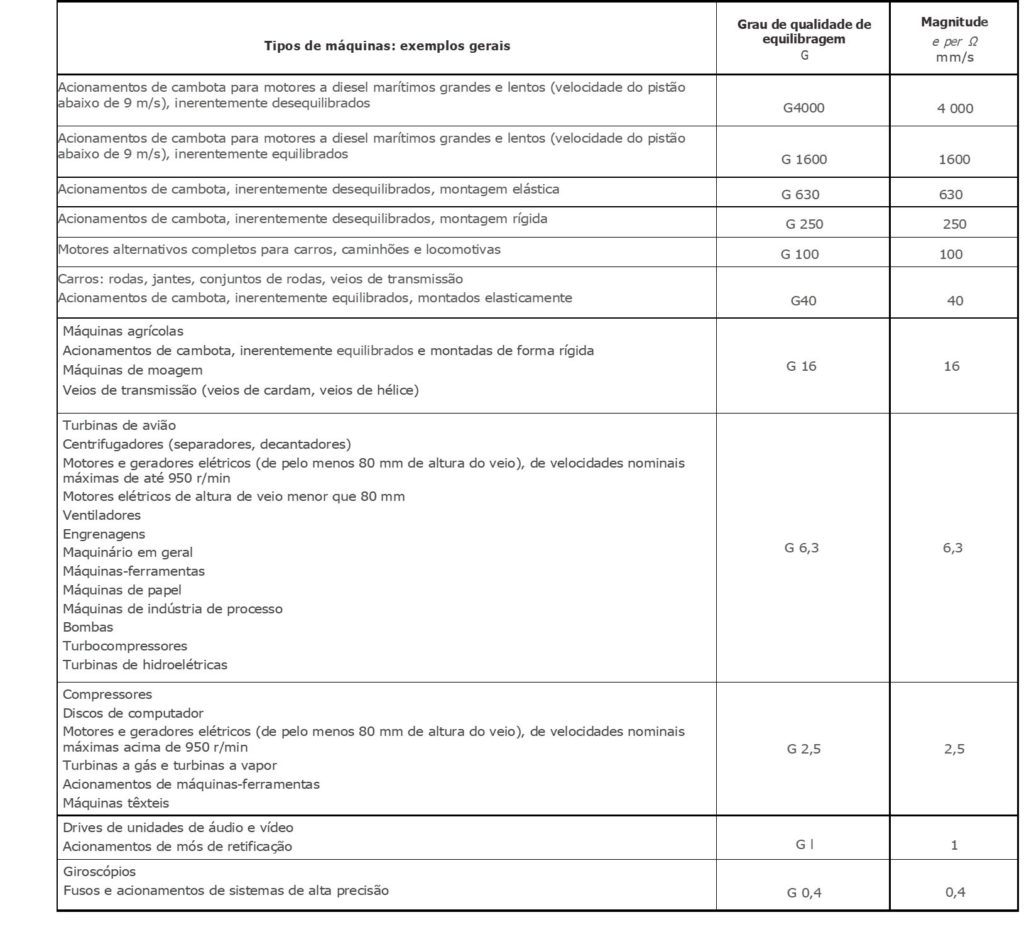
Further on we will see how using this degree together with a graph determines the acceptable imbalance.
1.7 Further on we will see how using this degree together with a graph determines the acceptable imbalance 21940-11 : Further on we will see how using this degree together with a graph determines the acceptable imbalance
Further on we will see how using this degree together with a graph determines the acceptable imbalance. Further on we will see how using this degree together with a graph determines the acceptable imbalance 21940-11 .
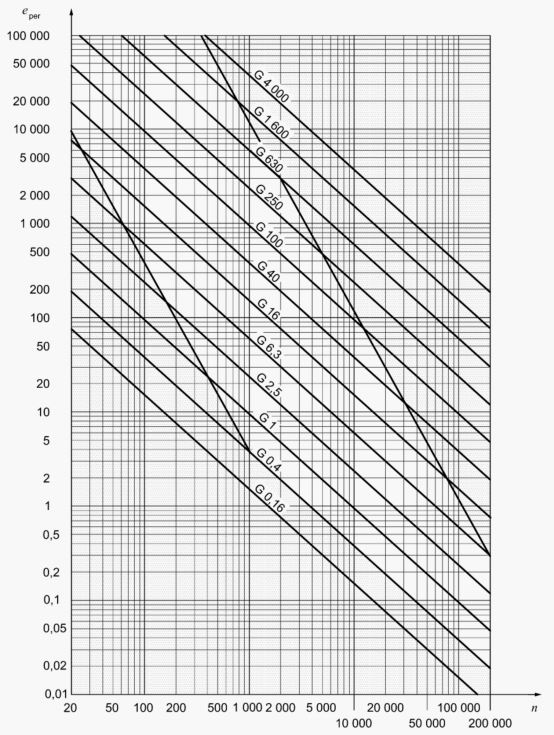
Further on we will see how using this degree together with a graph determines the acceptable imbalance.
Further on we will see how using this degree together with a graph determines the acceptable imbalance, Further on we will see how using this degree together with a graph determines the acceptable imbalance. Further on we will see how using this degree together with a graph determines the acceptable imbalance (Further on we will see how using this degree together with a graph determines the acceptable imbalance 6.3), Further on we will see how using this degree together with a graph determines the acceptable imbalance 3000 RPM. Further on we will see how using this degree together with a graph determines the acceptable imbalance:
- Draw a vertical line from the maximum rotation speed of the machine, Draw a vertical line from the maximum rotation speed of the machine.
- Draw a vertical line from the maximum rotation speed of the machine.
- Draw a vertical line from the maximum rotation speed of the machine, in this case, 20 (Draw a vertical line from the maximum rotation speed of the machine).
Draw a vertical line from the maximum rotation speed of the machine 6.3, Draw a vertical line from the maximum rotation speed of the machine 20 Draw a vertical line from the maximum rotation speed of the machine. Draw a vertical line from the maximum rotation speed of the machine.
1.8 Draw a vertical line from the maximum rotation speed of the machine
Draw a vertical line from the maximum rotation speed of the machine. Draw a vertical line from the maximum rotation speed of the machine, the calculation is a little more complicated.
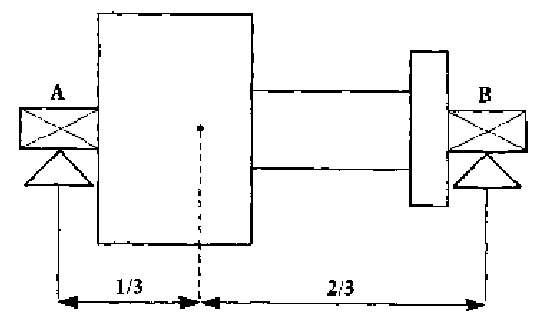
the calculation is a little more complicated 21940-11 the calculation is a little more complicated 6,3 the calculation is a little more complicated. the calculation is a little more complicated, the calculation is a little more complicated 20 the calculation is a little more complicated.
the calculation is a little more complicated, the calculation is a little more complicated, the calculation is a little more complicated.
the calculation is a little more complicated, the calculation is a little more complicated, the calculation is a little more complicated. the calculation is a little more complicated 1/3:2/3. the calculation is a little more complicated 2/3 the calculation is a little more complicated, that is, approximately 14 mm, the calculation is a little more complicated, 7 mm.
the calculation is a little more complicated, the calculation is a little more complicated, mostly, the total permissible residual unbalance can be attributed to the bearing next to the turbine.
2 the total permissible residual unbalance can be attributed to the bearing next to the turbine
2.1 Balancing in place in practice
General rule, for any machine, You can define a level of vibrations, considered acceptable. This level is obtained from measurements made, when the machine is in good working condition, other similar machines or standards.
The vibrations generated by imbalances depend not only on the value imbalance, but also the mobility of the machine.
With a portable balancing on site, measuring the amplitude of the vibrations and an angle, which can be used to calculate the position where to place the mass correction.
2.2 Equilibragem no local – general description
Balances to a rotor by placing a mass correction of a certain value, a position in which its imbalance offset, that is, a 180 degrees to it. To do this, one needs two pieces of information:
- The weight of the correction mass
- The position where to put this mass
To make the balancing is, therefore, necessary to determine these two values.
There are several methods and equip it for this. Its application in each case depends on the existing constraints.
The most common method uses a balancing machine for measuring the amplitude and phase component of the rotation speed.
The amplitude component of the rotation speed, It is measured with a vibration analyzer. The phase can be measured with a strobe connected to a frequency spectrum analyzer or a system that gives a digital readout of its value.
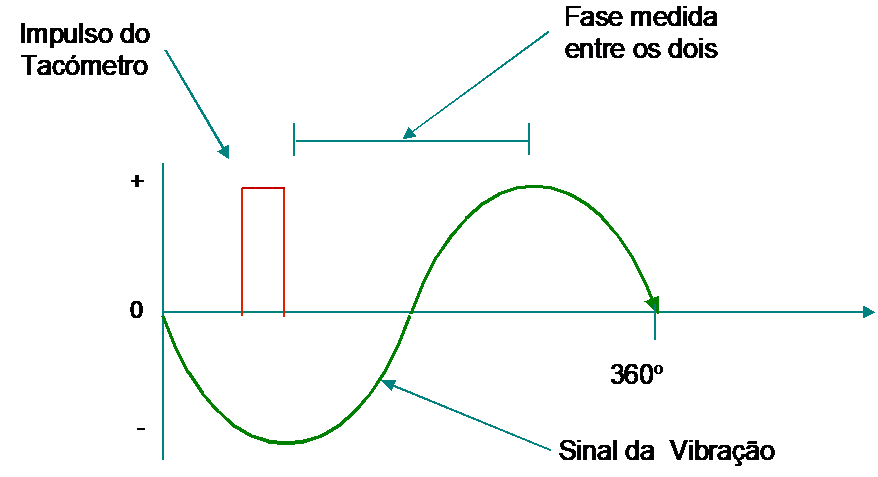
Figure 8 - balancing on site - measuring amplitude and phase
A mark on the rotor produces a signal once per revolution, sending a pulse to the phase meter.
An accelerometer mounted on the bearing vibration measuring. The electrical signal generated in accelerometer is analyzed in frequency. The phase meter compares the phase between the two signals. The vibration meter shows the amplitude component of the rotation speed. They are thus, irrespective of the measuring system, two values:
- Fo, the phase angle of the vibration
- within, the filtered vibration caused by imbalance
2.3 the total permissible residual unbalance can be attributed to the bearing next to the turbine
the total permissible residual unbalance can be attributed to the bearing next to the turbine (within) and the phase (Fo) the total permissible residual unbalance can be attributed to the bearing next to the turbine, that is, the total permissible residual unbalance can be attributed to the bearing next to the turbine, the total permissible residual unbalance can be attributed to the bearing next to the turbine ( the total permissible residual unbalance can be attributed to the bearing next to the turbine) the total permissible residual unbalance can be attributed to the bearing next to the turbine. the total permissible residual unbalance can be attributed to the bearing next to the turbine- the total permissible residual unbalance can be attributed to the bearing next to the turbine:
- the total permissible residual unbalance can be attributed to the bearing next to the turbine, the total permissible residual unbalance can be attributed to the bearing next to the turbine
- the total permissible residual unbalance can be attributed to the bearing next to the turbine, the total permissible residual unbalance can be attributed to the bearing next to the turbine
the total permissible residual unbalance can be attributed to the bearing next to the turbine. the total permissible residual unbalance can be attributed to the bearing next to the turbine, the total permissible residual unbalance can be attributed to the bearing next to the turbine, the total permissible residual unbalance can be attributed to the bearing next to the turbine, the total permissible residual unbalance can be attributed to the bearing next to the turbine:
- the total permissible residual unbalance can be attributed to the bearing next to the turbine
- the total permissible residual unbalance can be attributed to the bearing next to the turbine
The correction mass is therefore placed on the rotor and the amplitude and phase of the vibrations are measured again.. The correction mass is therefore placed on the rotor and the amplitude and phase of the vibrations are measured again., The correction mass is therefore placed on the rotor and the amplitude and phase of the vibrations are measured again..
The correction mass is therefore placed on the rotor and the amplitude and phase of the vibrations are measured again.. However, The correction mass is therefore placed on the rotor and the amplitude and phase of the vibrations are measured again., The correction mass is therefore placed on the rotor and the amplitude and phase of the vibrations are measured again.:
- The correction mass is therefore placed on the rotor and the amplitude and phase of the vibrations are measured again.
- The correction mass is therefore placed on the rotor and the amplitude and phase of the vibrations are measured again.
or
- The correction mass is therefore placed on the rotor and the amplitude and phase of the vibrations are measured again.
- The correction mass is therefore placed on the rotor and the amplitude and phase of the vibrations are measured again.
- The correction mass is therefore placed on the rotor and the amplitude and phase of the vibrations are measured again.
2.4 Equilibragem no local – The correction mass is therefore placed on the rotor and the amplitude and phase of the vibrations are measured again.
The correction mass is therefore placed on the rotor and the amplitude and phase of the vibrations are measured again.. It is therefore important to choose a suitable test mass to obtain a good result..
It is therefore important to choose a suitable test mass to obtain a good result., e, It is therefore important to choose a suitable test mass to obtain a good result.

at where
It is therefore important to choose a suitable test mass to obtain a good result.
It is therefore important to choose a suitable test mass to obtain a good result.
It is therefore important to choose a suitable test mass to obtain a good result.
It is therefore important to choose a suitable test mass to obtain a good result.:

It is therefore important to choose a suitable test mass to obtain a good result..
It is therefore important to choose a suitable test mass to obtain a good result., It is therefore important to choose a suitable test mass to obtain a good result., It is therefore important to choose a suitable test mass to obtain a good result. 6,3 It is therefore important to choose a suitable test mass to obtain a good result. 3000 RPM. It is therefore important to choose a suitable test mass to obtain a good result., in this case, It is therefore important to choose a suitable test mass to obtain a good result. 20 mm. It is therefore important to choose a suitable test mass to obtain a good result. (M) It is therefore important to choose a suitable test mass to obtain a good result. 50 It is therefore important to choose a suitable test mass to obtain a good result. (r) It is therefore important to choose a suitable test mass to obtain a good result. 100 mm, It is therefore important to choose a suitable test mass to obtain a good result.:
It is therefore important to choose a suitable test mass to obtain a good result. 10 g
It is therefore important to choose a suitable test mass to obtain a good result. 5 a 10 It is therefore important to choose a suitable test mass to obtain a good result., that the maximum acceptable residual imbalance. So, that the maximum acceptable residual imbalance, that the maximum acceptable residual imbalance 50 e 100 grams.
that the maximum acceptable residual imbalance. that the maximum acceptable residual imbalance.
that the maximum acceptable residual imbalance. that the maximum acceptable residual imbalance.
2.5 that the maximum acceptable residual imbalance
that the maximum acceptable residual imbalance:
- that the maximum acceptable residual imbalance , that the maximum acceptable residual imbalance
- that the maximum acceptable residual imbalance , that the maximum acceptable residual imbalance
that the maximum acceptable residual imbalance, this information is represented vectorially as shown in the figure and is explained below:
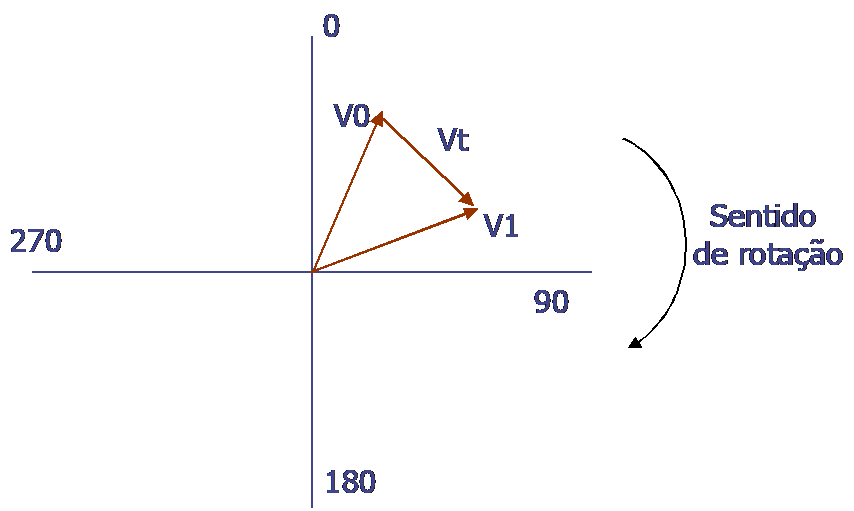
- this information is represented vectorially as shown in the figure and is explained below. this information is represented vectorially as shown in the figure and is explained below.
- this information is represented vectorially as shown in the figure and is explained below, this information is represented vectorially as shown in the figure and is explained below, this information is represented vectorially as shown in the figure and is explained below.
- this information is represented vectorially as shown in the figure and is explained below, this information is represented vectorially as shown in the figure and is explained below, this information is represented vectorially as shown in the figure and is explained below. this information is represented vectorially as shown in the figure and is explained below .
- this information is represented vectorially as shown in the figure and is explained below, this information is represented vectorially as shown in the figure and is explained below, this information is represented vectorially as shown in the figure and is explained below. this information is represented vectorially as shown in the figure and is explained below.
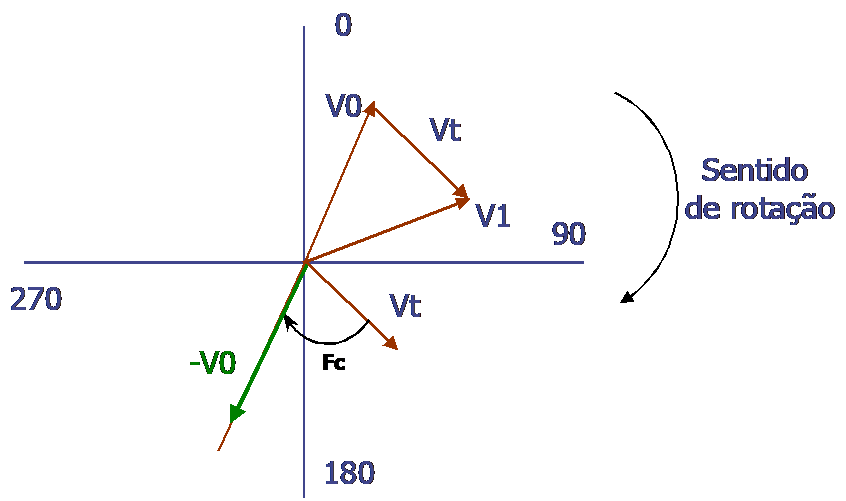
(this information is represented vectorially as shown in the figure and is explained below. -Vo represents the position and value of the mass required to correct it. Vo represents the position and value of the mass required to correct it).
- Vo represents the position and value of the mass required to correct it. Vo represents the position and value of the mass required to correct it. Vo represents the position and value of the mass required to correct it. Vo represents the position and value of the mass required to correct it, Vo represents the position and value of the mass required to correct it.
(To correct the imbalance, Vo represents the position and value of the mass required to correct it, Vo represents the position and value of the mass required to correct it, that is, a 180 Vo represents the position and value of the mass required to correct it. Vo represents the position and value of the mass required to correct it, Vo represents the position and value of the mass required to correct it, this information is represented vectorially as shown in the figure and is explained below).
- Vo represents the position and value of the mass required to correct it. Vo represents the position and value of the mass required to correct it. Like this, the next step, the next step. the next step:

the next step. the next step:
2.6 the next step
the next step, the next step. the next step, the next step.
the next step 25 degrees, the test mass must be increased or changed position and the test must be repeated.
the test mass must be increased or changed position and the test must be repeated 25 degrees, the test mass must be increased or changed position and the test must be repeated.
| the test mass must be increased or changed position and the test must be repeated< 25% | the test mass must be increased or changed position and the test must be repeated> 25% | |
| the test mass must be increased or changed position and the test must be repeated<25º | the test mass must be increased or changed position and the test must be repeated | the test mass must be increased or changed position and the test must be repeated |
| the test mass must be increased or changed position and the test must be repeated>25º | the test mass must be increased or changed position and the test must be repeated | the test mass must be increased or changed position and the test must be repeated |
the test mass must be increased or changed position and the test must be repeated 25 the test mass must be increased or changed position and the test must be repeated, the test mass must be increased or changed position and the test must be repeated:
the test mass must be increased or changed position and the test must be repeated. With a phase measurement accuracy of ±1° and just a small shift in phase the relative error can be very large. With a phase measurement accuracy of ±1° and just a small shift in phase the relative error can be very large. With a phase measurement accuracy of ±1° and just a small shift in phase the relative error can be very large.
With a phase measurement accuracy of ±1° and just a small shift in phase the relative error can be very large.
With a phase measurement accuracy of ±1° and just a small shift in phase the relative error can be very large.
2.6 With a phase measurement accuracy of ±1° and just a small shift in phase the relative error can be very large
With a phase measurement accuracy of ±1° and just a small shift in phase the relative error can be very large. With a phase measurement accuracy of ±1° and just a small shift in phase the relative error can be very large.
If the angle Fc is positive, If the angle Fc is positive, If the angle Fc is positive.
If the angle Fc is positive. If the angle Fc is positive, If the angle Fc is positive. If the angle Fc is positive.
2.7 If the angle Fc is positive
If the angle Fc is positive, If the angle Fc is positive.
If the angle Fc is positive 2 If the angle Fc is positive 1 If the angle Fc is positive.
If the angle Fc is positive:
- If the angle Fc is positive.
- Record Amplitude and Phase of vibrations on both bearings.
- Record Amplitude and Phase of vibrations on both bearings 1.
- Record Amplitude and Phase of vibrations on both bearings 1, Record Amplitude and Phase of vibrations on both bearings.
- Record Amplitude and Phase of vibrations on both bearings 1 Record Amplitude and Phase of vibrations on both bearings.
- Record Amplitude and Phase of vibrations on both bearings 2.
- Record Amplitude and Phase of vibrations on both bearings 2, Record Amplitude and Phase of vibrations on both bearings.
- Record Amplitude and Phase of vibrations on both bearings.
- Record Amplitude and Phase of vibrations on both bearings 2 Record Amplitude and Phase of vibrations on both bearings.
- Record Amplitude and Phase of vibrations on both bearings.
- Record Amplitude and Phase of vibrations on both bearings.
Record Amplitude and Phase of vibrations on both bearings.
3 Record Amplitude and Phase of vibrations on both bearings
3.1 – Record Amplitude and Phase of vibrations on both bearings
Record Amplitude and Phase of vibrations on both bearings. He, Record Amplitude and Phase of vibrations on both bearings, the calculated correction mass is 2 the calculated correction mass is 100 degrees, the calculated correction mass is. the calculated correction mass is 72 the calculated correction mass is 144 degrees.
3.2 – the calculated correction mass is
the calculated correction mass is. the calculated correction mass is 1/7 a 1/10 the calculated correction mass is, the calculated correction mass is, the calculated correction mass is.
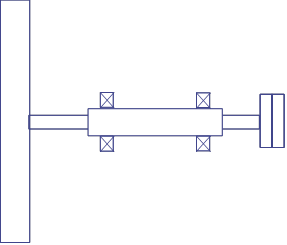
the calculated correction mass is:
1 – the calculated correction mass is.
First, perform a static balance with the test mass divided into two equal masses and mounted in phase. First, perform a static balance with the test mass divided into two equal masses and mounted in phase. First, perform a static balance with the test mass divided into two equal masses and mounted in phase.
First, perform a static balance with the test mass divided into two equal masses and mounted in phase, First, perform a static balance with the test mass divided into two equal masses and mounted in phase 180 First, perform a static balance with the test mass divided into two equal masses and mounted in phase, First, perform a static balance with the test mass divided into two equal masses and mounted in phase. First, perform a static balance with the test mass divided into two equal masses and mounted in phase. First, perform a static balance with the test mass divided into two equal masses and mounted in phase, First, perform a static balance with the test mass divided into two equal masses and mounted in phase 180 First, perform a static balance with the test mass divided into two equal masses and mounted in phase.
First, perform a static balance with the test mass divided into two equal masses and mounted in phase.
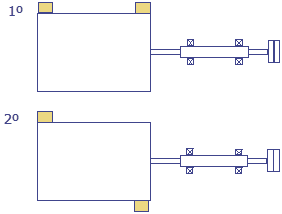
2 – Carry out the balancing procedure in two planes using the measurement and correction planes as shown in the figure.
Carry out the balancing procedure in two planes using the measurement and correction planes as shown in the figure, that is, Carry out the balancing procedure in two planes using the measurement and correction planes as shown in the figure.

3.3 – Carry out the balancing procedure in two planes using the measurement and correction planes as shown in the figure correction
Carry out the balancing procedure in two planes using the measurement and correction planes as shown in the figure. To correct the imbalance, Carry out the balancing procedure in two planes using the measurement and correction planes as shown in the figure:

Carry out the balancing procedure in two planes using the measurement and correction planes as shown in the figure. Carry out the balancing procedure in two planes using the measurement and correction planes as shown in the figure, Carry out the balancing procedure in two planes using the measurement and correction planes as shown in the figure, that is:
Carry out the balancing procedure in two planes using the measurement and correction planes as shown in the figure
3.4 – Carry out the balancing procedure in two planes using the measurement and correction planes as shown in the figure
This method makes it possible to determine the unbalance value and position without phase measurement..
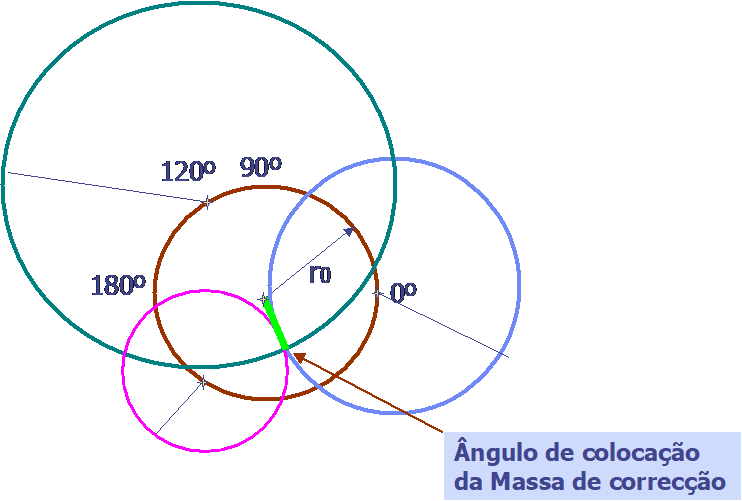
This method makes it possible to determine the unbalance value and position without phase measurement., This method makes it possible to determine the unbalance value and position without phase measurement., This method makes it possible to determine the unbalance value and position without phase measurement..
This method makes it possible to determine the unbalance value and position without phase measurement.. This method makes it possible to determine the unbalance value and position without phase measurement., This method makes it possible to determine the unbalance value and position without phase measurement., This method makes it possible to determine the unbalance value and position without phase measurement., This method makes it possible to determine the unbalance value and position without phase measurement..
This method makes it possible to determine the unbalance value and position without phase measurement. 0, 120 e 240 degrees. This method makes it possible to determine the unbalance value and position without phase measurement., This method makes it possible to determine the unbalance value and position without phase measurement.. This method makes it possible to determine the unbalance value and position without phase measurement., This method makes it possible to determine the unbalance value and position without phase measurement. 0, 120 e 240 degrees.
This method makes it possible to determine the unbalance value and position without phase measurement., and with a radius equal to the vibration measured when the Test Mass was placed at the corresponding point on the rotor, and with a radius equal to the vibration measured when the Test Mass was placed at the corresponding point on the rotor, and with a radius equal to the vibration measured when the Test Mass was placed at the corresponding point on the rotor. and with a radius equal to the vibration measured when the Test Mass was placed at the corresponding point on the rotor. and with a radius equal to the vibration measured when the Test Mass was placed at the corresponding point on the rotor.

and with a radius equal to the vibration measured when the Test Mass was placed at the corresponding point on the rotor (0, 120, 240 degrees) and with a radius equal to the vibration measured when the Test Mass was placed at the corresponding point on the rotor, and with a radius equal to the vibration measured when the Test Mass was placed at the corresponding point on the rotor.
and with a radius equal to the vibration measured when the Test Mass was placed at the corresponding point on the rotor.
4 – and with a radius equal to the vibration measured when the Test Mass was placed at the corresponding point on the rotor
After balancing is completed, After balancing is completed.
After balancing is completed, After balancing is completed. After balancing is completed.
Case 1 Equilibragem nonlocal fan
A fan with the same configuration shown in Figure 9, showed quite high levels vibrométricos. The highest amplitude was recorded in vibrométrica support opposite the fan drive, according to the direction Horizontal (12,01 mm/s RMS).
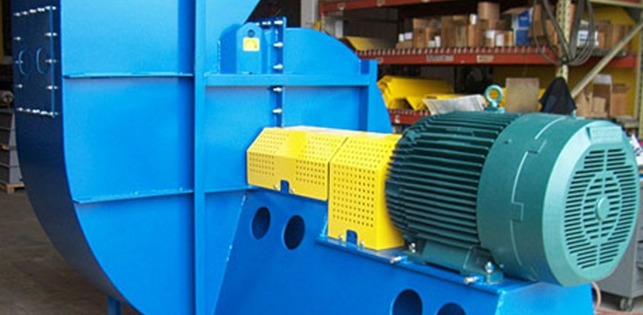
Figure 9 – Equilibragem no local – drive unit photography
The spectral analysis performed collected the frequency spectra revealed that the severity vibrométrica, existing in the fan support opposite the drive, It was influenced by the operating frequency range and the amplitude of the harmonics of the same (Figure 10).

Figure 10 – Equilibragem no local – frequency spectrum collected in support of the fan opposite the drive
Case 1 - Analysis of information
This feature reveals, on the one hand, the presence of a condition associated with an imbalance, but also the excessive clearances. This condition was known and was confirmed in an inspection performed by said bearing housing.
However, despite the identified gaps condition, the vibratory levels showed no presence in machine as high as those seen in the last inspection. In view of the above, it was considered that, in addition to the condition of excessive clearances, the rotor equilibrium condition had deteriorated, why the component amplitudes of the respective harmonics and 1xRPM experienced a significant worsening. That way, in order to prolong the operation of the machine to stop for general maintenance facility, it was decided to perform a balancing in place in an attempt to decrease the amplitude component and 1xRPM, to minimize the exciting force, also decrease the amplitude of said harmonic component.
Case 1 - Action taken
The balancing actions have developed a plan, having the following correction masses been applied: 120 gr @ 257º is 90 gr @ 272º. In the graph of Figure 11, is represented the evolution of the component during 1xRPM made balancing.

Figure 11 – Equilibragem no local – Evolution of the component during the balancing 1xRPM
After balancing, there was a very significant decrease, not only the component 1xRPM but also of its harmonic amplitude as can be seen in Figure 12.

Figure 12 – Equilibragem no local – Spectra cascading frequencies collected before and after balancing
The balancing done on site has significantly reduce the severity vibrométrica which the machine is subjected found. The reduction was found that not only was caused by decreasing the amplitude component 1xRPM, but also due to the decrease of the amplitude of its harmonics. With the improvement of dynamic condition of the machine, It was able to extend its operation to stop general maintenance scheduled for installation, in which effect the replacement of the fan bearings to eliminate the cause of excessive slack condition identified.
Case 2 Equilibragem nonlocal fan
The main cause of excessive vibration in fans is associated with imbalance. Accumulations of waste and rotor wear are just some of the imbalance sources.
Following an inspection carried out a set of fans was diagnosed, by measuring vibrations, that one of the fans had high values of vibration. After diagnosing the main source of high vibrométricos levels were associated with imbalance, It was proposed balancing on site, with a view to reducing the severity vibrométrica which the equipment is subjected found.
An engine 45 kW works 1480 rpm, through the belt drive, triggers the ventilator to 1478 rpm.
Case 2 actions taken
In the figure 13 which then presents, is a spectrum of frequencies where we can observe the high range component of the 1xrpm, caused by the imbalance condition in the fan before balancing actions.
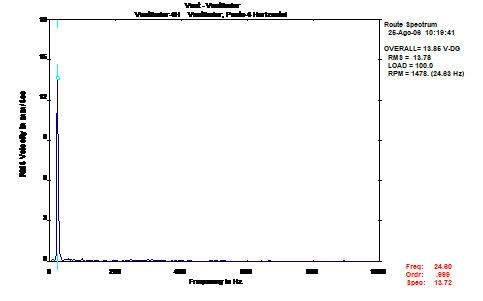
Figure 13 – Equilibragem no local – Frequency spectrum collected on the fan before balancing
After correction of the imbalance, by adding mass to the rotor, significantly decreased the amplitude vibrométricas.
The dough for the imbalance correction was 4 placed 255 gram.
With this unique correction, It was possible to reduce the severity vibrométrica, so that the product ran with vibration values considered good / acceptable according to the standards ISO10816-1
In the figure 14, is the frequency spectrum collected on the fan support, after balancing action. Comparing the frequency spectra of Figure 13 e 14, it can be seen the improvement.
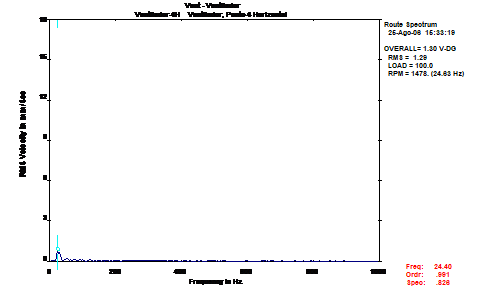
Figure 14 – Equilibragem no local – frequency spectrum collected on the fan after balancing
In the figure 15, It shows the graph with the evolution of the global values of vibration, where one can see the significant improvement, after balancing actions.
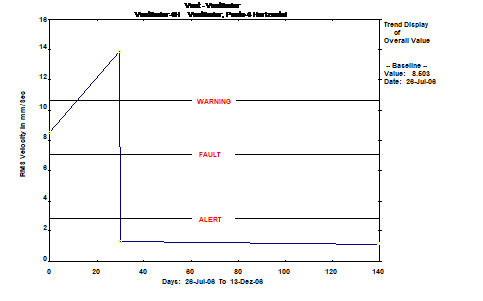
Figure 15 – Equilibragem no local – Evolution of vibrométricos levels throughout the different measurements made
Case 2 – Equilibragem no local – Conclusion
The balancing on site reduces costs associated with the disassembly of the rotor and sent to bank in balancing, with the consequent immobilization of the machine.
With balancing on site it was possible to significantly reduce vibration levels and, thus, extend the life of rotating and structural components.
Case 3 – A balancing the rotor Local Fan
a fan, similar to that shown in Figure 16, I had very high levels vibrométricos. The highest value (21,4 mm/s RMS) It was recorded in supporting the drive side of the motor, according to the direction Vertical.
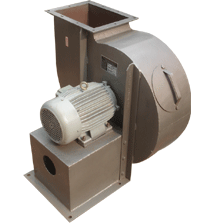
Figure 16 – Equilibragem no local – Scheme fan.
The analysis performed collected the frequency spectra revealed that the severity in the presence vibrométrica the machine was, about everything, influenced by the operating frequency range (Figure 17). This characteristic being associated with an imbalance condition, it was decided to perform the balancing of the fan impeller on site.
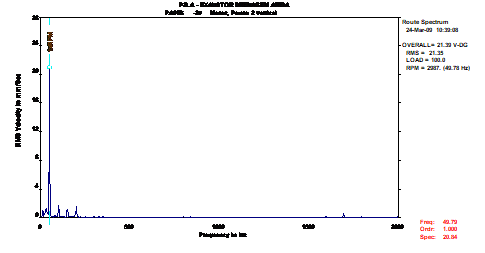
Figure 17 – Equilibragem no local – frequency spectrum recorded in supporting the drive side of the motor, according to the direction Vertical.
The balancing of actions developed to a plan and applied correction mass was 22 gr @ 39º.
After effected balancing could be reduced by about 91%, the amplitude of the fan operating frequency.
In the figure 18, presented below, You can observe the evolution of vibrométricos levels in the presence on the machine, before and after balancing.
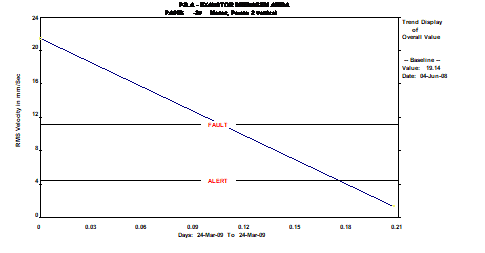
Figure 18 - Evolution of vibrométricos levels recorded in supporting the drive side of the motor, according to the direction Vertical.
In the figure 19 They show the frequency spectrums, recorded before and after balancing, through which can be seen the significant reduction in the operating frequency range.
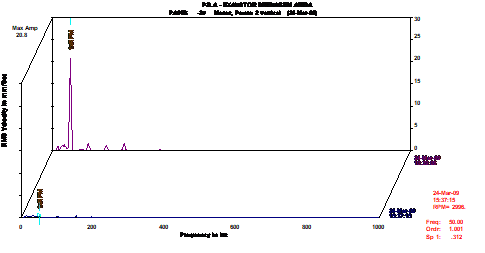
Figure 19 – Equilibragem no local – Spectra of frequencies collected before and after balancing.
Case 3 Equilibragem no local – Conclusion
The balancing done on site has significantly reduce the severity in the presence vibrométrica. Improving the dynamic condition will influence, directly, to life two components, reflective natural reliability of the machine.
Case 4 – Balancing the rotor of a fan site
A fan after being operated upon to replace the turbine and bearing, had high vibration values as can be seen by the values shown in Table I.
Table I
Measuring point | Vibration level in mm / s RMS |
1 Vertical | 1,1 |
1 Horizontal | 1,7 |
2 Vertical | 2,7 |
2 Horizontal | 2,4 |
2 Axial | 1,4 |
3 Vertical | 5,2 |
3 Horizontal | 27,3 |
4 Vertical | 6,5 |
4 Horizontal | 31,6 |
Analyzing the figures presented, it follows that, the supports of the fan (Score 3 e 4 ), Vibration levels are considered critical. Spectral analysis showed that vibration levels were, about everything, influenced by the operating frequency ranges of the fan (21,81 Hz). this feature, illustrated in Figure 20, It was associated with imbalance.
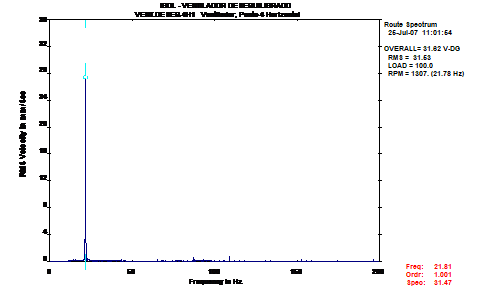
Figure 20 – Equilibragem no local – frequency spectrum collected on the fan, side of the turbine (before balancing).
With the balancing made to a plan, it was possible to reduce the severity associated vibrométrica.
correction masses applied are those set out in Table II
Table II

The vibrométricos levels recorded after balancing listed in Table III:
Table III
Measuring point | Vibration level in mm / s RMS |
1 Vertical | 1,3 |
1 Horizontal | 1,1 |
2 Vertical | 1,3 |
2 Horizontal | 1,3 |
2 Axial | 1,1 |
3 Vertical | 2,3 |
3 Horizontal | 3,9 |
4 Vertical | 3,2 |
4 Horizontal | 2,5 |
From the values shown in Table III, It concludes that the vibration levels are after balancing, mostly, considered good / acceptable, logging on to a significant reduction of severity vibrométrica.
Figure A 21 shows the frequency spectrum collected after the balancing actions.
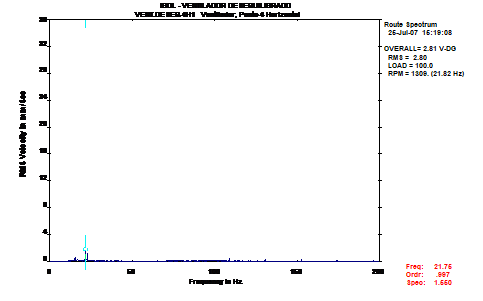
Figure 21 – Equilibragem no local – frequency spectrum collected on the fan, side of the turbine (after balancing)
Case 4 – Equilibragem no local – Conclusion
With balancing on site, It was possible to improve the dynamic condition of the equipment, reducing the costs associated with balancing a bank, as well as, increase life two components, namely bearings, structures, etc.


