Resonance diagnosis with vibration analysis
Resonance diagnosis with vibration analysis
1 – Introduction
The diagnosis of resonance with Vibration Analysis is the theme covered in this article..
2 – Variations in amplitude of vibrations when starting a machine
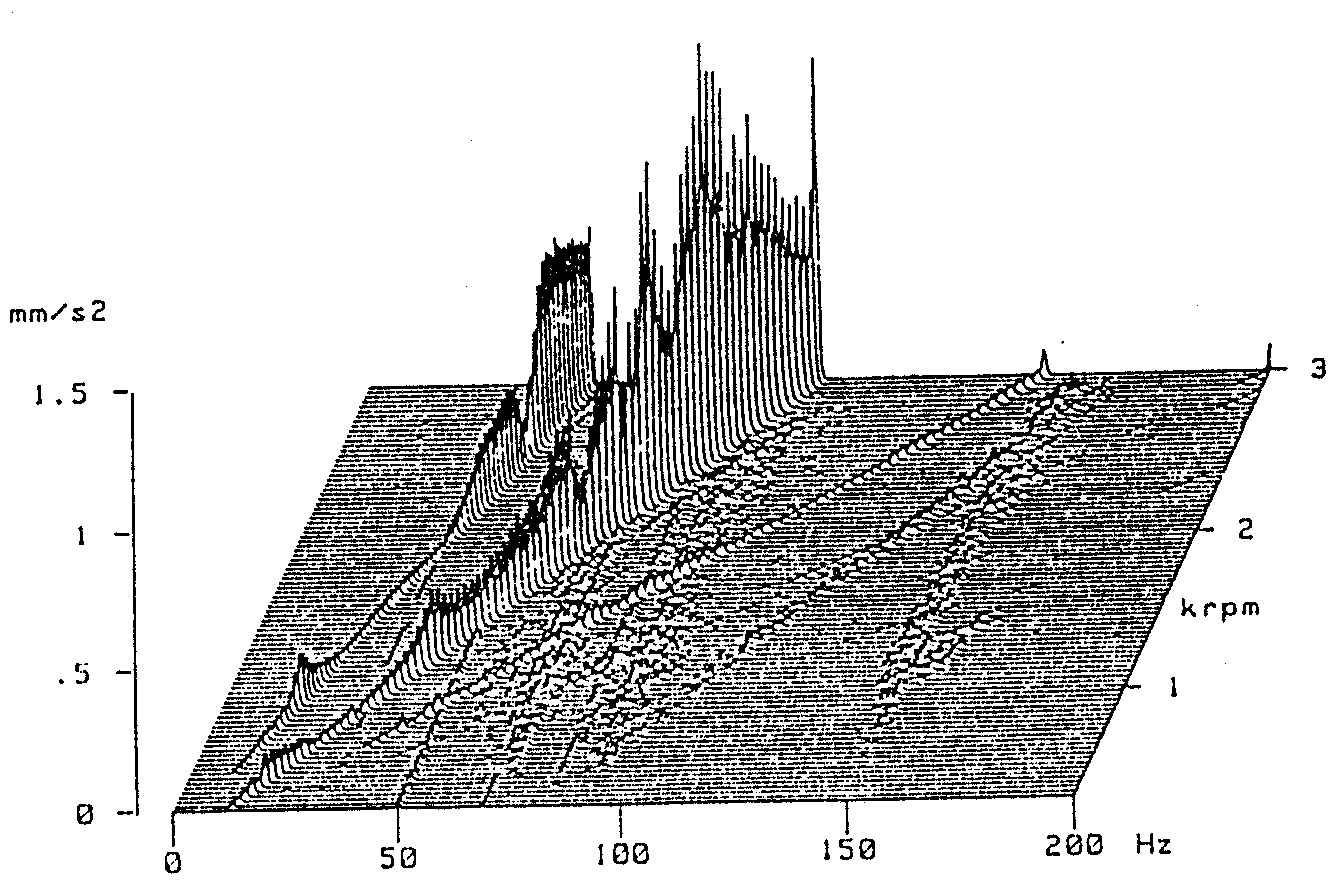
Note the succession of measured spectra in the bearing of a generator, during its boot.
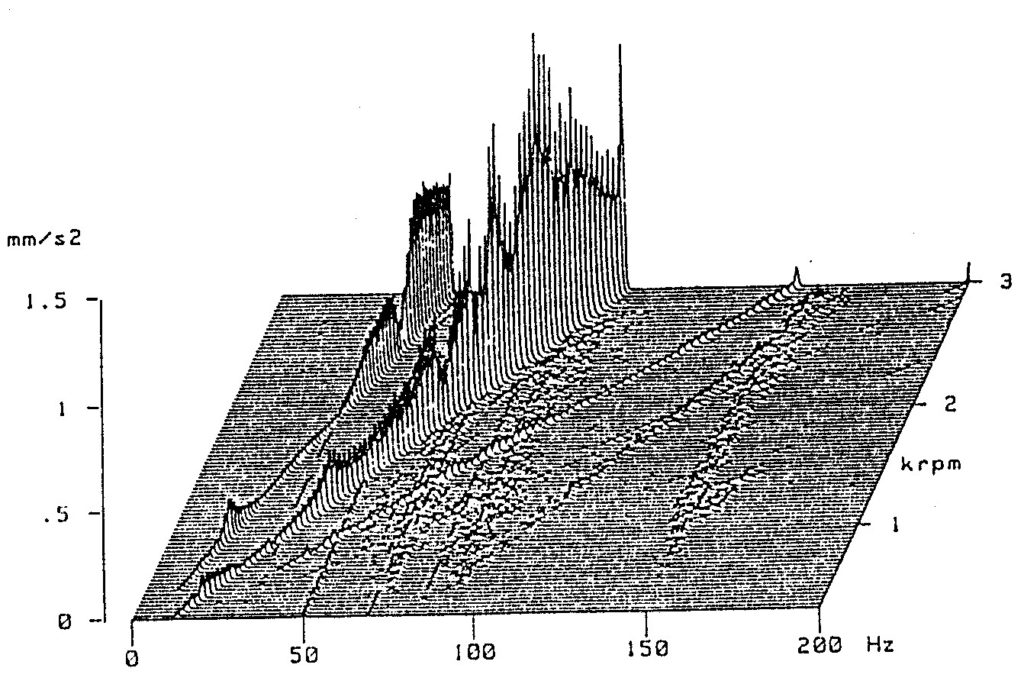
The amplitude of the component at the speed of rotation instead of growing continuously, as would be expected if it depended solely on centrifugal force (the centrifugal force is equal to the mass times the square of the angular velocity), have periods during machine acceleration where it decreases, as seen in the figure below.
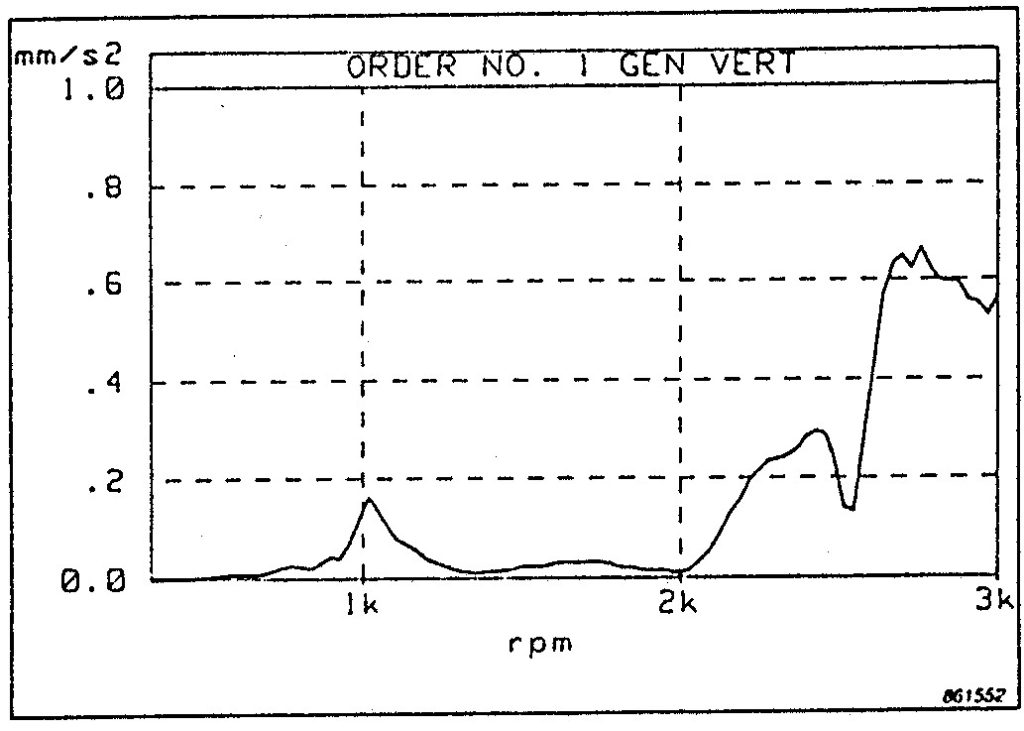
The explanation of this effect is linked with the resonance phenomenon.
It is everyone's experience that sometimes large-scale vibrations occur in neighboring machines or structures. Tubes or supports that never vibrated abnormally, when occurs, for example an imbalance in a nearby machine, begin to vibrate with amplitudes even greater than the machine. They amplify the vibrations. Under these conditions, the tube or support is said to be in resonance. If left for too long under these circumstances, they can end up cracking and breaking. This can also happen in the next machine components that can also vibrate in resonance..
If this happens, it is very possible that the machine will need frequent repairs, being out of service for a long time. Thus, the resonance phenomenon can present very serious aspects and is found with some frequency.
2 – Resonance diagnosis with vibration analysis – amplitude effect
Consider the evolution of the amplitude, from component to rotational speed, when booting a machine, supported directly on its supports and with a static imbalance, measured with a vibration analyzer.
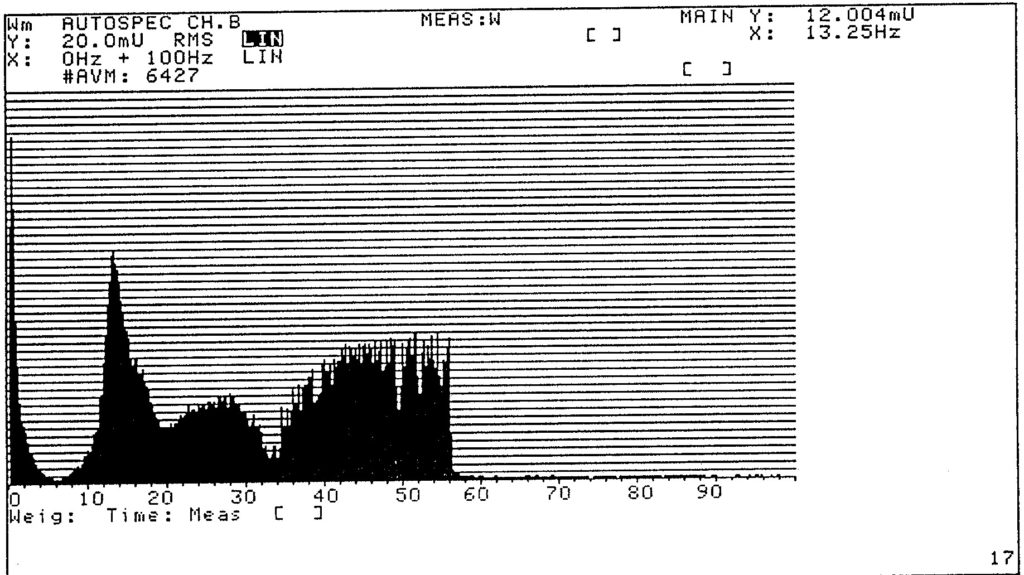
It is clearly observed that there are speeds to which the maximum vibrations correspond.. When these maximums are reached the resonance phenomenon occurs and the machine is said to be vibrating at its natural frequency.
3 – the natural frequency
A natural frequency of a structure is a property that depends on its rigidity and mass..
We are used to appreciating all the objects we see in the terms our senses present them, that is: cor, smell, this, etc. These are characteristics that we recognize as inherent to everything.. Natural Frequency is another characteristic of objects, it's just that our senses don't pick it up directly.
They exist, However, situations where we can get a direct idea of the natural frequency.
Let us consider the case of a pendulum. It is known that the speed at which an oscillation completes only depends on the length of the wire and its mass.. We speak thus of the natural frequency of the pendulum that only depends on these characteristics, what is easily visible.
The formula that gives the Natural Frequency of a structure is as follows:

K – Rigidity
M – Pulp
The Natural Frequency is also the frequency at which a structure is to vibrate when subjected to an impact and left to vibrate on its own.
4 – The Impact Test
So when you have an impact on a structure and the vibrations are measured, you get to know its natural frequencies. is the call Impact Test.
This type of test is one of the simplest ways to measure the natural frequencies of a structure with measuring vibrations.
Below you can see the result of the Impact Test on a machine. Note the coincidence in frequency between the highest peak of this spectrum with the one in the previous figure.
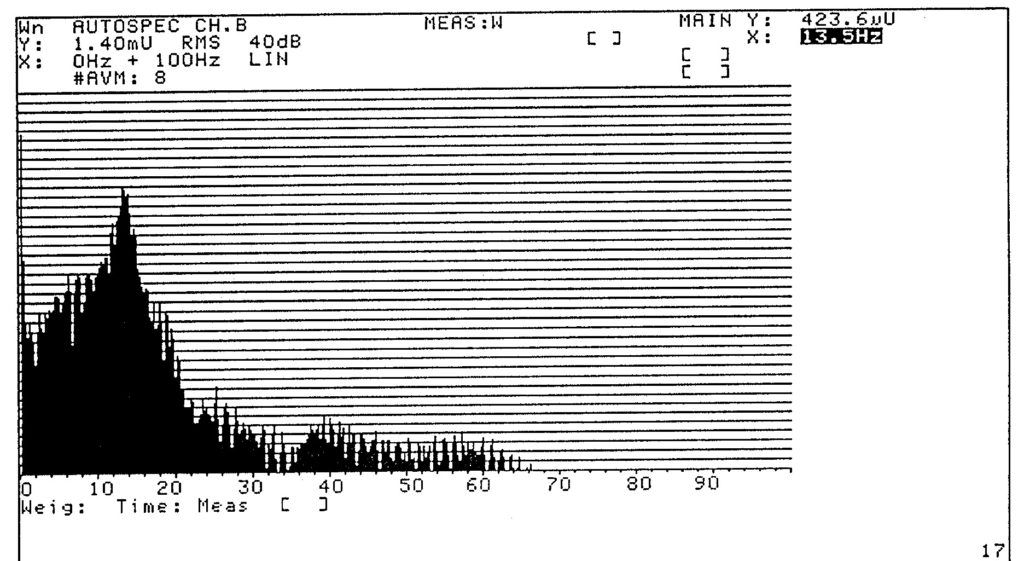
A structure does not have only one Natural Frequency.
an electric motor, for example, according to the direction, so it has different degrees of rigidity. This gives at least one natural frequency for each direction.
In this way, when the Impact Test is carried out, several natural frequencies appear.
Furthermore, it is seen that each direction of a machine has its own Natural Frequencies, it can happen that a machine is in resonance only in one direction. If resonance occurs, this fact is to be expected. When this happens the amplitude of the vibrations in this direction is disproportionately large in relation to the amplitudes in the other directions.
5 – The directionality of vibrations
This directionality of vibrations is one of the symptoms of the resonance phenomenon and must be taken into account when diagnosing resonance with vibration analysis..
6 – Resonance diagnosis with vibration analysis – phase effect
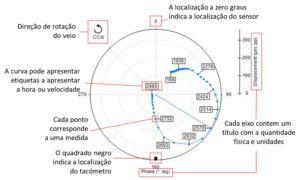
Returning to the example of the machine, the effect on the amplitude of the vibrations is observed parallel to, also an effect on the phase, in a similar way to what is seen in the figure below..
In this one can observe the evolution of the Phase (top of the figure) and the amplitude of the vibrations (bottom) during machine startup.
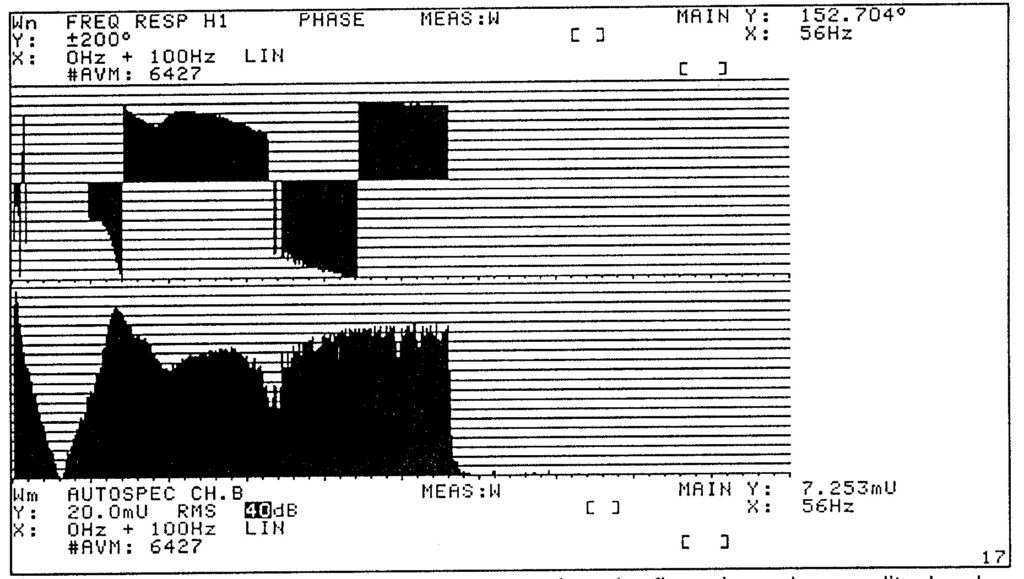
Effectively the phase when passing an resonance (or anti-resonance) varies 180 °, as can be seen in the figure below, which shows the evolution of Amplitude and Phase of vibrations during the acceleration of an electric motor.
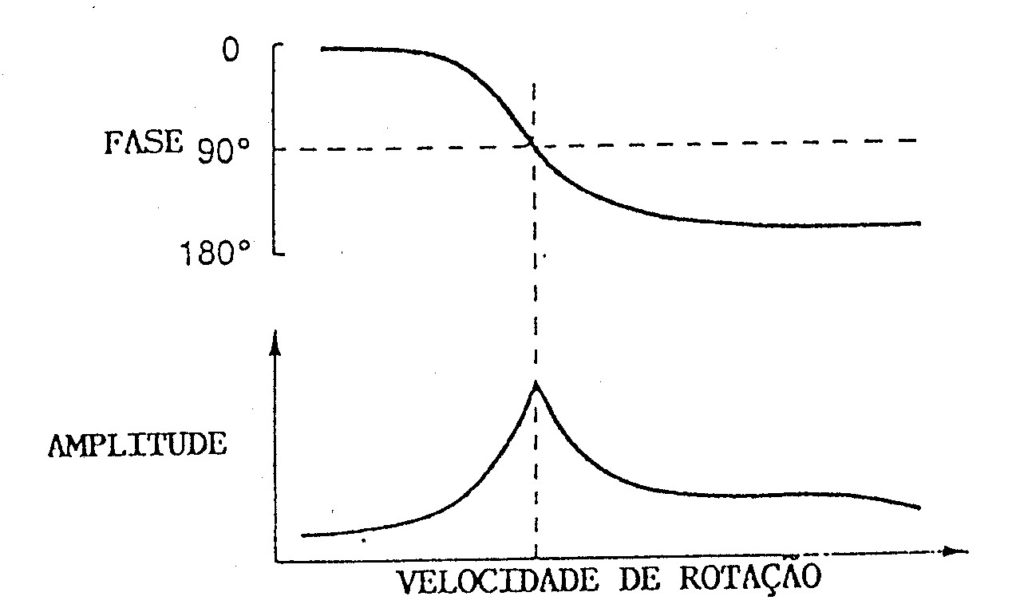
This phase variation is another symptom of resonance phenomena.. Note also that in the resonance zone the phase varies very quickly, while away from the resonance zones the phase is almost independent of the machine speed. So if you want to read the phase of a vibration corresponding to a resonance, this will sometimes prove to be almost impossible due to the instability of the reading..
Phase instability is thus a symptom of resonance.
7 – Vibration mode in resonance diagnosis with vibration analysis
Associated with each Natural Frequency of a structure is a Vibration Mode.
This Vibration Mode is simply the way the structure deforms while vibrating.
In everyday life it is a very easy phenomenon to visualize on machines with the aid of a strobe, or else on slow machines.
To visualize it, proceed as follows:
- Find a machine that has strong vibrations
- With a strobe, synchronize the flash to the predominant vibration frequency (most of the time it is the shaft rotation speed.)
- Unsync flash speed about 60 RPM and observe machine movement
Under these conditions it will often be possible to directly observe the Vibration Mode of the machine in operation.
In the shaft of a machine, the first and second vibration modes are generally those shown in the figure below..
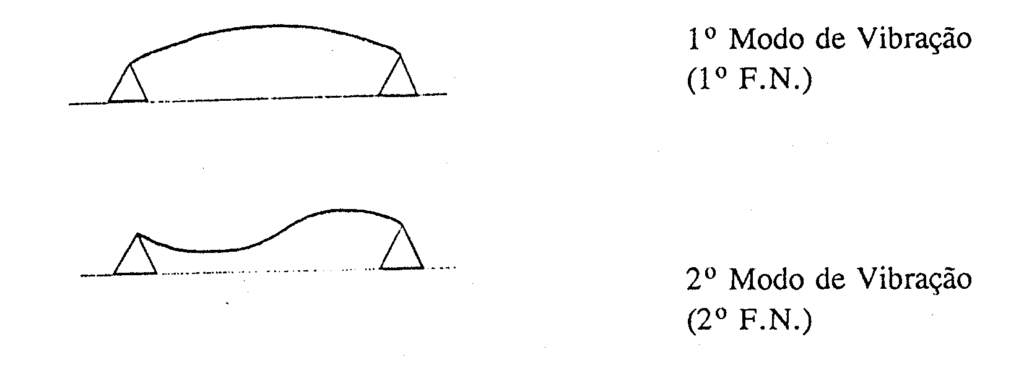
If the deformation of the 2nd mode is carefully observed, one easily comes to the conclusion that the shaft point is subject to high alternating bending efforts. IS, therefore, natural that if the vein vibrates at the second natural frequency, and therefore, with the 2nd Vibration Mode, cracks appear at its midpoint.
Thus the repeated appearance of cracks, always at a given point of a structure or machine, is one of the strongest symptoms of resonance.
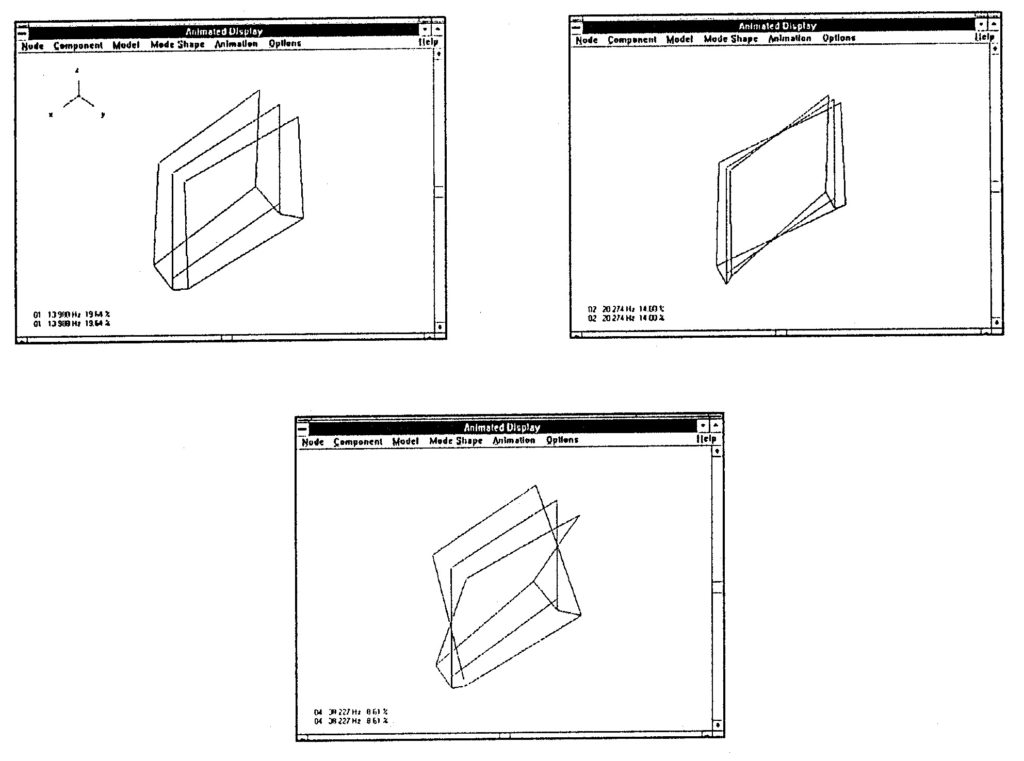
In the figure below you can see, the first, the second and third Vibration Modes of a machine in the form of a parallelepiped. (front-rear direction). These figures were obtained with Modal Analysis.
8 – Summary of diagnostic techniques, tests and symptoms in resonance diagnosis with vibration analysis
This type of test is one of the simplest ways to measure the natural frequencies of a structure with predictive maintenance.
| symptoms | Description |
| Amplitude | Abnormally high levels of vibration |
| Directionality | Very high levels in one direction and almost normal in others |
| Phase | Variations in the phase of vibrations difficult to explain otherwise |
| vibration mode | Easily recognizable vibration mode |
| cracks | Systematic occurrence of cracks at the same sites |
The following table summarizes the tests and techniques that should be considered in the diagnosis of resonance with vibration analysis.
| Rehearsal | Technique |
| Start and stop control | Frequency spectrum, overall level of vibrations, spectral map, Bode. |
| phase measurement | phase measurement system (digital or strobe) |
| vibration mode | Frequency spectrum, overall level of vibrations, strobe, modal analysis. |
| Impact test | Frequency spectrum, frequency response function. |
9 – PRACTICAL CASES OF RESONANCE
a) Resonance in vertical machine structure

