Bearing protection practical case
Bearing protection practical case
1 – Bearing protection practical case – introduction
This article describes a practical case of bearing protection.
2 – Bearing protection practical case - the initial situation
An electric motor manufacturer received a complaint from one of the customers, motivated by excessive noise produced by one of the units.
In order to identify the source of the high noise, DMC developed several actions in order to characterize and solve the abnormal behavior.
2.1 Vibration measurement startsl
When placed on a test bench, it was found that, effectively, the noise was extremely loud. For this facto, a measuring vibrations was carried out with the unit operating at about 500 RPM, so as not to jeopardize the physical integrity of its components.
In Tables I and II the Global Vibration Levels in Velocity and Acceleration are presented.
TABLE I
Global Vibration Level
Vibration Speed in mm.s-1 RMS
| Point of Measurement | Machine Organ | Global Vibration Level |
| 1 Horizontal | Motor | 1,19 |
| 2 Vertical | Motor | 1,52 |
| 2 Horizontal | Motor | 1,20 |
| 2 Axial | Motor | 0,72 |
TABLE II
Global Vibration Level
Vibration Acceleration in RMS Gas
| Point of Measurement | Machine Organ | Global Vibration Level |
| Opposite Side Drive | Motor | 0,21 |
| Drive Side | Motor | 0,30 |
As can be seen in the previous tables, the vibrometric levels recorded with the two measurement parameters used (Speed and Acceleration) have amplitudes considered low.
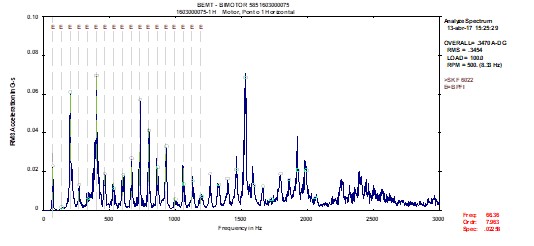
However, a Vibration Analysis made with a vibration analyzers, revealed the presence of frequencies associated with the development of anomalies in installed bearings (Figure 1).
2.2 The recommendations made
Since the tests were performed at a speed lower than the actual engine operation (500RPM Vs 1.270RPM), replacement of motor bearings was recommended. Even more, the analysis of the replaced bearings was recommended in order to identify the possible root cause that motivated the premature degradation of the bearings.
2.3 What was found
In the figure 2 photographs of the raceways of one of the replaced bearings are shown.
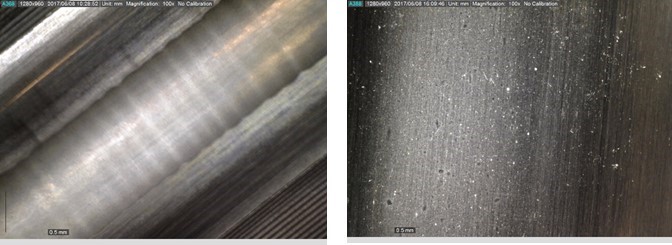
Analysis of the present marks of the replaced bearings (Figure 2), indicated the presence of the phenomenon of "Fluting”, which results from the passage of current through the bearing.
3 Measurements after replacement
3.1 Vibrations
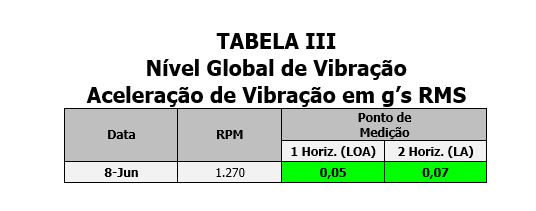
After replacement of the bearings, new measurements were taken with a vibration analyzer to characterize the operating condition of the machine in terms of predictive maintenance.
To assess the condition of installed bearings, measurements were taken with the Vibration acceleration parameter, using a frequency band up to 10KHz.
The results obtained are shown in Table III, finding the values highlighted with the colors corresponding to the adopted evaluation criteria.
3.2 tensions in the shaft
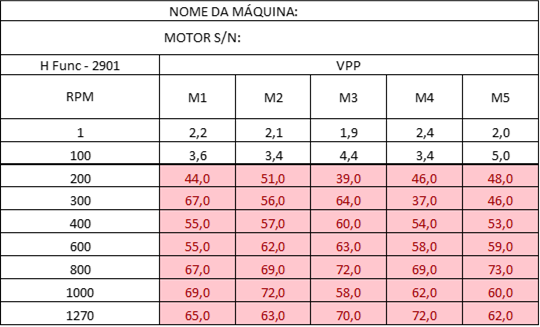
Analysis of the present marks of the replaced bearings (Figure 2) indicated the presence of the phenomenon of "Fluting”, which results from the passage of current through the bearing. In view of this suspicion and as a way to confirm it, were carried out too Shaft Voltage measurements do motor.
In Table IV, the results of the measurements performed are displayed., finding themselves highlighted with color, voltage values greater than 10,0 V Peak-Peak (value from which the phenomenon is very likely to occur).

As can be seen in Table IV, measured values are significantly greater than 10.0 V Peak‑Peak.
3.3 Measurement of vibrations and tension on the shaft on similar machines
As the results obtained pointed as the root cause for the premature degradation of the motor bearings, the passage of current through the bearings, the question was raised whether this situation was an isolated case or if, could be at issue a recurrent situation that would affect all engines already manufactured and to be manufactured.
In order to answer the question asked, the manufacturer has chosen to carry out vibration and tension measurements on the shaft at 12 engines equal and already running.
US 12 engines, five measurements were taken at various operating regimes and, practically in all operating regimes, Voltage values are greater than the limit of 10,0 V Peak-Peak.
In the figure 3, the Waveform recorded in one of the measurements is displayed.
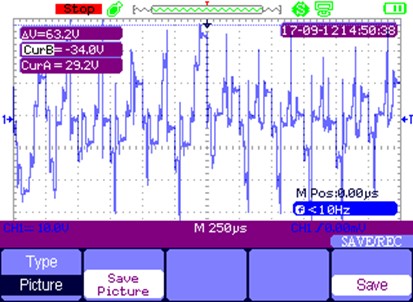
Figure 3 – Waveform recorded in the engine shown in Table II a 600 RPM
Table V shows the voltage values measured on the shaft of one of the motors of this installation.
TABLE V
In Table VI, the values of the other engines are presented in a summarized way.. In that table, only the results with the highest Voltage values are shown.
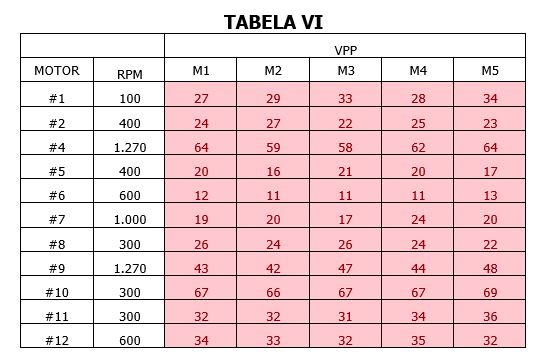
According to the data presented in the previous table, voltages on the shaft with amplitudes greater than 10.0V Peak-Pico were recorded in all motors analyzed. In recorded waveforms, there were voltage drops, caused by continuous discharges in bearings.
Simultaneously with the Shaft Voltage measurement test, vibration measurement was also carried out., the engines being in the regime of 1.270 RPM.
In the following table, the overall vibration levels recorded on the engine mounts are displayed..
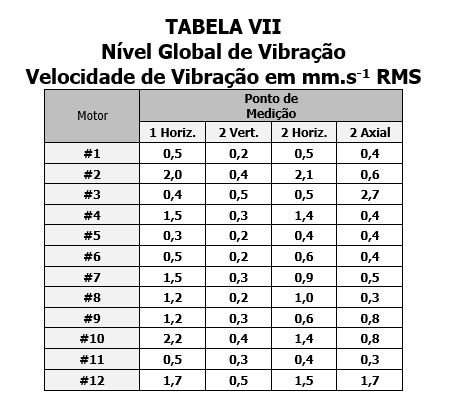
Analysis of the data presented in Table VII, reveals that the vibrometrics recorded in the engine mounts are considered acceptable.
To assess the condition of installed bearings, measurements were taken with the Vibration Acceleration parameter, using a frequency band up to 10 KHz, with the engines running at 1.270 RPM. The results obtained are shown in Table VIII, being highlighted with the colors corresponding to the adopted evaluation criteria.
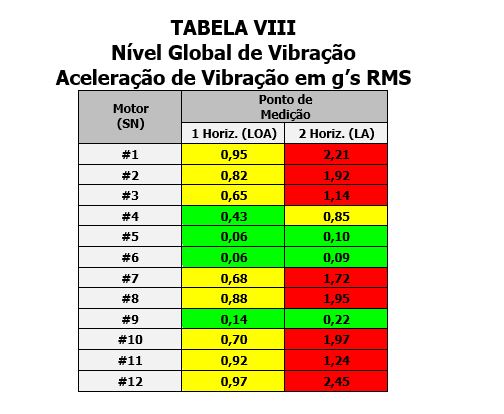
Analysis of the values presented in Table VIII, reveals that most engines inspected have acceleration values considered Severe/Critical. Only three of the engines under review, present acceleration amplitudes considered Good in both supports.
The analysis of the spectra recorded with the Acceleration parameter and a maximum frequency of 10 KHz, revealed the presence of an energy band with very remarkable amplitudes.
this feature, illustrated in Figure 4 and Figure 5, is usually associated with phenomena related to metal-to-metal contact..
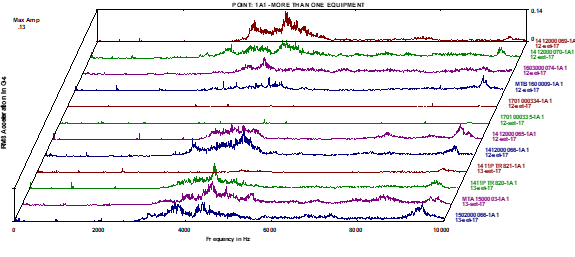
Figure 4 – Frequency spectra recorded with the Acceleration parameter on the supports opposite the actuation of the 12 inspected engines (Sorted from top to bottom in ascending order)
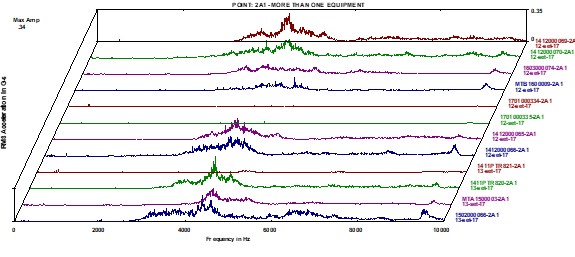
Figure 5 – Frequency spectra recorded with the Acceleration parameter at the supports on the drive side of the 12 inspected engines (Sorted from top to bottom in ascending order)
4 bank rehearsal
After the results obtained in the 12 tested engines, the manufacturer developed a test that consisted of:
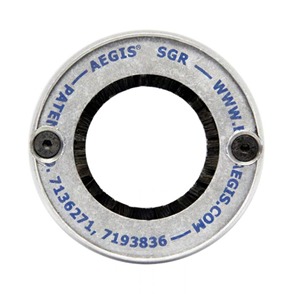
- Install a bearing protection ring (Figure 6) in an engine;
- Run the engine on the test bench during 80 hours and perform the voltage and vibration measurement at the end of the test.
The voltage values measured at the motor shaft are shown in the following table.
TABLE IX
Shaft Voltage Values
| Data | tension in the shaft (VPP) |
| 1 from December | 0,8 |
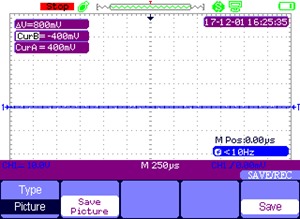
According to the data presented in the previous table, the voltage values recorded are considered Good (values less than 5 V Peak-Peak). In the following figure, the Waveform recorded during the measurement is displayed..
In the following table, the overall vibration levels recorded at the end of the test on the engine mounts are shown..
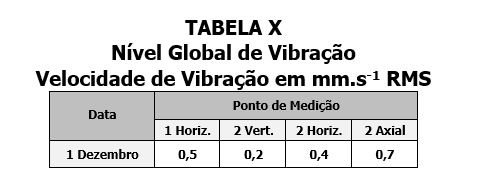
The analysis of the data presented in Table X revealed that the vibrometric levels registered in the engine supports are considered Good.
To assess the condition of installed bearings, measurements were taken with the Vibration Acceleration parameter, using a frequency band up to 10 kHz. The results obtained are shown in Table XI, finding the values highlighted with the colors corresponding to the adopted evaluation criteria.
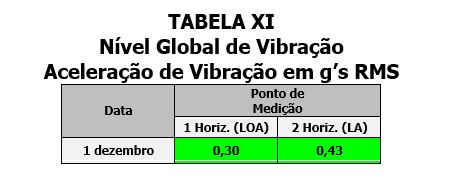
Analysis of the data presented in Table XI, reveals that the acceleration values recorded in any of the measurements taken are considered Good.
5 – Bearing protection practical case – final solution adopted
After the tests carried out and the results obtained, the manufacturer chose to install on all engines, as a way of mitigating the phenomenon, a ring for the "discharge" of tensions on the shaft (Figure6 ) and so, perform bearing protection.

