Thermal imaging assessment
This article deals with the topic of thermal image evaluation.
1 – Thermal imaging assessment – The benefits and advantages of radiometric temperature measurements
One radiometric thermal camera measures the temperature of a surface by interpreting the intensity of an infrared signal that reaches the camera.
Adding radiometric functionality to a camera can give technicians the ability to save images for post-inspection analysis and accurately measure the temperatures of individual pixels in the image. Adding radiometric imaging allows technicians to capture temperature data at every pixel of an image. Technicians can thus analyze and send detailed reports and images that examine temperature data across the entire picture, providing quantifiable results.
2 – Thermal imaging assessment – Qualitative Thermography vs.. Quantitative
The ability to detect and visualize infrared energy with thermal cameras has huge benefits for users. During the last decade, especially, size innovations, weight and cost of thermal cameras, along with form factor updates, data analysis and processing software, made this technology invaluable in unforeseen ways.
With so many options – from unmanned aerial camera systems for search and rescue to optical gas imaging cameras to detect fugitive emissions – It's important to focus on key factors when selecting the right heat tool for your job. To begin, The question is whether qualitative or quantitative data are fundamental.
Thermal imaging assessment – Qualitative Thermography
For some applications, the operator only needs thermography or infrared data represented as a visual image, to interpret the scene and identify the source of a problem or the need for a repair. This qualitative thermography method provides the visual clue needed to act.
Thermal imaging assessment – Figure 1 – Qualitative thermography – Methane leak from a valve
Optical gas imaging is a qualitative technology that reveals gas leaks.
A valuable use of qualitative thermography involves search and rescue operations using a thermal camera attached to an unmanned aerial system. (UAS). In this scenario, researchers use the camera to locate warm human forms that stand out against a cooler background of the landscape. Thermal imaging is particularly useful at night or in other low-visibility situations that challenge human eyes or visible-light cameras.; no need to identify specific temperatures.
This same qualitative need can also apply to advanced driver assistance systems (ADAS) or autonomous vehicles. In this case, the goal is similar: the ability to identify specific objects on the road, especially people and large animals, that drivers want to avoid in low visibility situations.
Thermal imaging assessment – Quantitative thermography
On the other hand, There are times when a simple thermal image is not enough to interpret the scene. In these scenarios, the ability to detect and record the temperature of each pixel is vital to the success of the mission. In these cases, It is important to use a radiometric thermal camera – which means that the camera is capable of measuring the temperature of a given surface by interpreting the intensity of the infrared signal that reaches the camera.
With radiometric functionality in the camera, thermographers can save data for image analysis after inspection. Compatible software can accurately measure the temperatures of individual image pixels in the data, a critical process for industrial inspection. Whether they are looking at electrical panels, roofs, solar panels, substations or crops, Thermography inspectors can analyze temperature data after inspection and send detailed reports and images that provide quantifiable, actionable results.
Thermal imaging assessment – Figure 2 – Quantitative thermography
Thermal radiometric technology also plays a crucial role in condition monitoring and mechanical inspections, because it can not only identify anomalous hot or cold spots, but also provide the additional layer of temperature data needed to correctly diagnose potential problems. These hot or cold spots can mean a fault or potential failure in an electrical system., mechanical or critical to the installations. De facto, Early identification of these problems allows technicians to schedule repairs or replacements without the need for costly downtime.
3 Thermal imaging assessment – Functionalities of radiometric thermal cameras
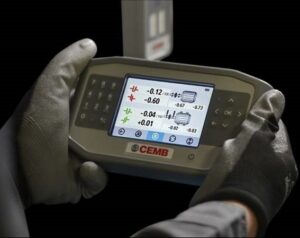
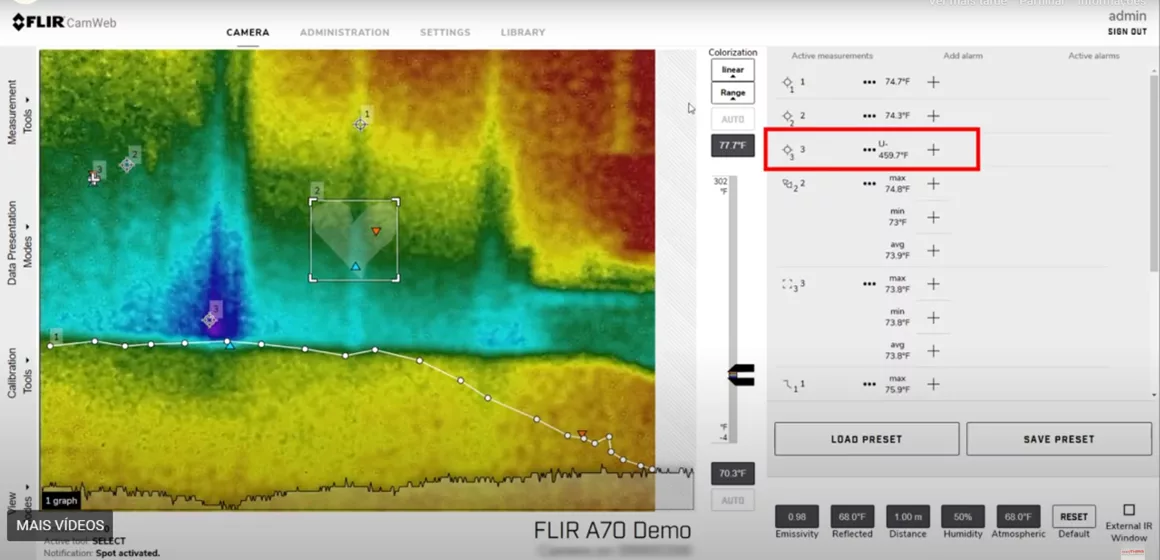
Radiometric thermal cameras often include useful features, such as a spot temperature gauge that the user can move or resize to better adapt to specific applications, or multiple spot temperature gauges that measure temperature ranges in different parts of the scene. This can be crucial in identifying the source of higher than normal heat., which may indicate electrical problems, mechanical or operational.
Thermal imaging assessment – Figure 3 – Radiometric thermal camera image
Despite the widespread use of radiometric thermography, It is important to recognize that there may be variations in actual temperature when capturing contactless temperature data. Remote sensing of a surface temperature depends on the ability to accurately compensate for surface characteristics, atmospheric interference and the imaging system itself. The emissivity, or the object's ability to emit infrared, and reflectivity, or the way the surface reflects infrared, can influence and reduce the overall accuracy of the recorded temperature by two degrees Celsius or more. Most thermal imaging cameras provide compensation settings that can take these surface characteristics into account and improve overall measurement accuracy..
4 – Thermal imaging assessment – Advanced features of radiometric thermal cameras
Some of the advantages of advanced radiometric cameras include:
- Improved accuracy (typical performance of the order of +5º C or 5% in high gain state, varying slightly across the operating temperature range)
- Movable and resizable spot meter (coordinates can be selected by the user for any location in the matrix)
- Additional Point Meter Data (average, standard deviation, minimum and maximum value)
- Linear digital data on scene temperature (operating in real time, pixel values in digital data correspond to the temperature of the scene)
- Detailed temperature information (users get information about the per-pixel temperature of objects in the scene)
- Temperature accuracy (allows external scene parameters to be compensated for emissivity – a measure of the efficiency of a surface to emit thermal energy relative to a perfect blackbody source – and by window transmission, to determine the temperature more accurately)
- Image Metrics Functionality (allows users to query the camera for scene temperature data via a serial command, such as the maximum, the minimum and standard deviation for user-defined regions).
- Some cameras with advanced radiometric technology even have the ability to compensate for camera temperature variations. This allows users to receive an output that has been stabilized and normalized, resulting in a “video with stable temperature”; a scene with a certain temperature will always correspond to a certain digital value in the video, Regardless of Chamber Temperature.
It is important to distinguish temperature measurements as surface infrared measurements because radiometric measurements should be restricted to optically opaque materials. Metals and organic materials (like people) are usually completely opaque and radiometric measurements should be able to determine the temperature of their surface.
Remote sensing of a surface temperature depends on the ability to accurately compensate for surface characteristics, atmospheric interference and the image system itself. Surface characteristics that influence temperature measurement are the emissivity and reflectivity of the surface in the wavelengths of the infrared spectrum.
5 – Thermal imaging assessment – Measurement tools
Point tool
The time tool is a temperature measurement tool that presents the temperature reading of a specific point in the image. This tool is useful when it is necessary to measure the temperature of a specific area of the image with high accuracy.

Thermal imaging assessment – Figure 4 - The point tool
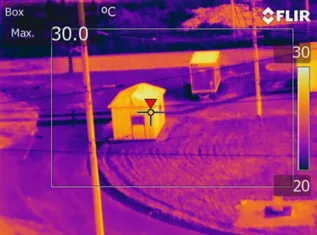
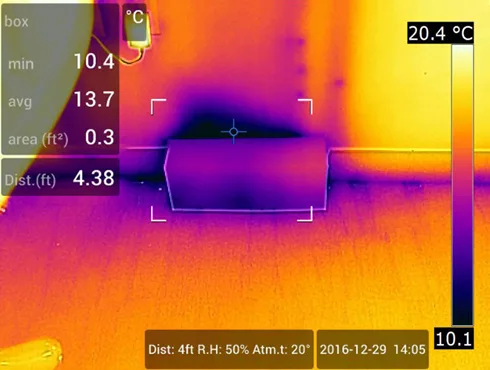
Cash tool
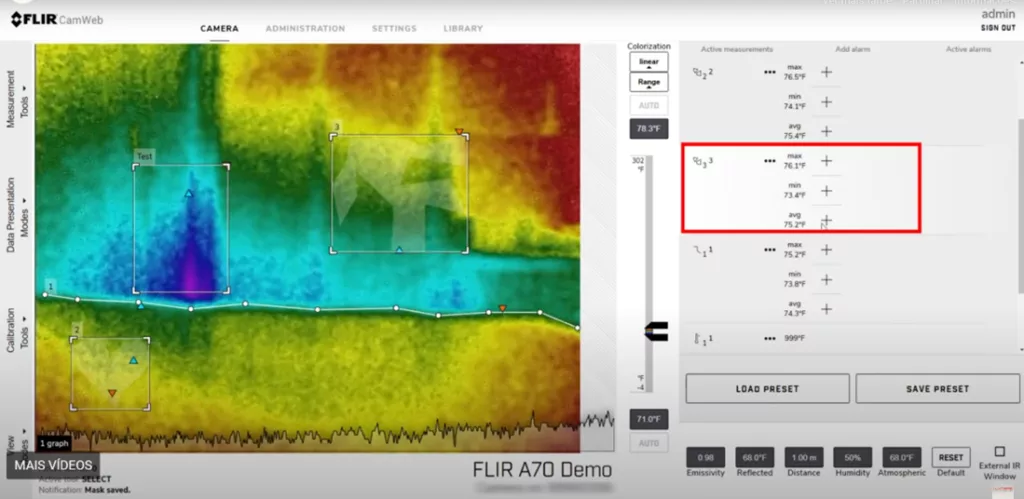
The cash tool has the minimum temperature, maximum and medium within a selected rectangular area of the image. It is particularly useful when measuring the temperature of a large area of the image.
Thermal imaging assessment – Figure 5 – The box tool
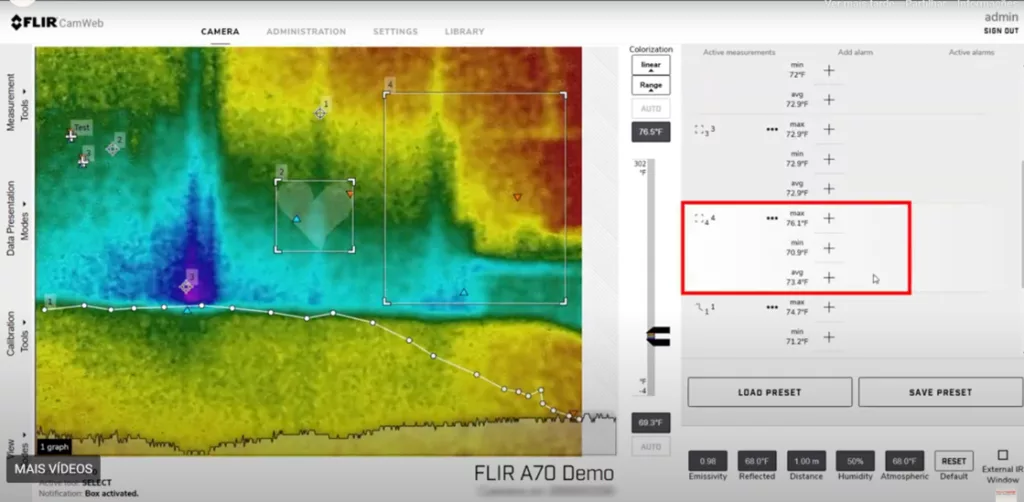
Measurement Mask Tool
The measurement mask tool is used to capture and measure more complex shapes in the image. This tool shows the minimum temperature, the maximum temperature and average temperature within a selected image shape, making it ideal for measuring irregularly shaped objects.
Thermal imaging assessment – Figure 6 – The mask tool
Line Tool
Line tool shows minimum temperature, the maximum temperature and the average temperature in the selected line. It is particularly useful for measuring temperature variations along a specific path.
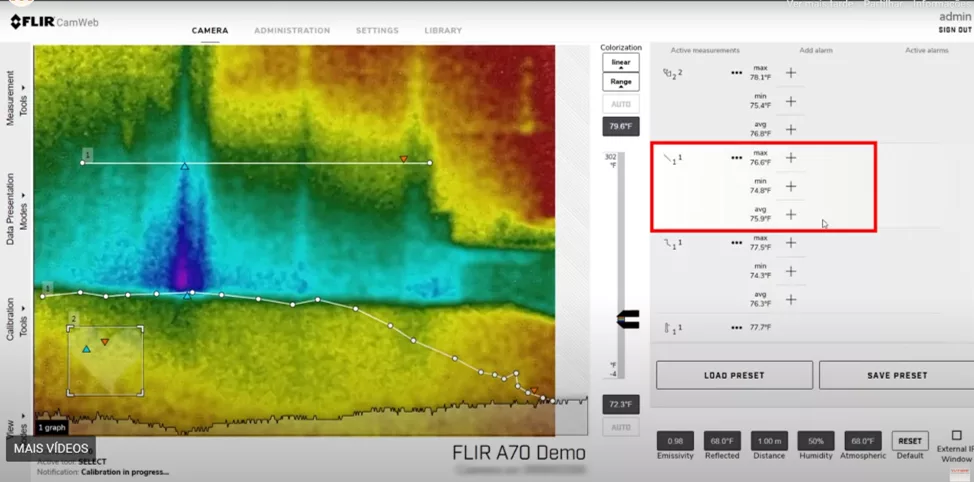
Thermal imaging assessment – Figure 7 – The line tool
Polygonal Line Tool
The polygonal line tool is similar to the line tool, but allows you to measure temperature variations along a series of connected lines drawn on the image. Displays the minimum temperature, the maximum temperature and the average temperature within the polygonal line.
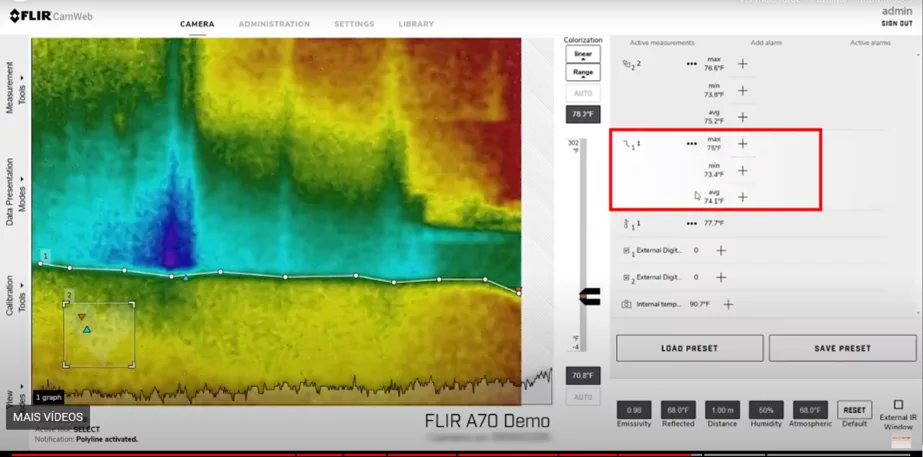
Thermal imaging assessment – Figure 8 – The polygonal line tool
Delta Tool
The delta tool is used to calculate the difference between two temperature measurements or between a temperature measurement and a fixed temperature known as the reference temperature. This tool is particularly useful for measuring temperature variations over time or for comparing two different areas in the image.
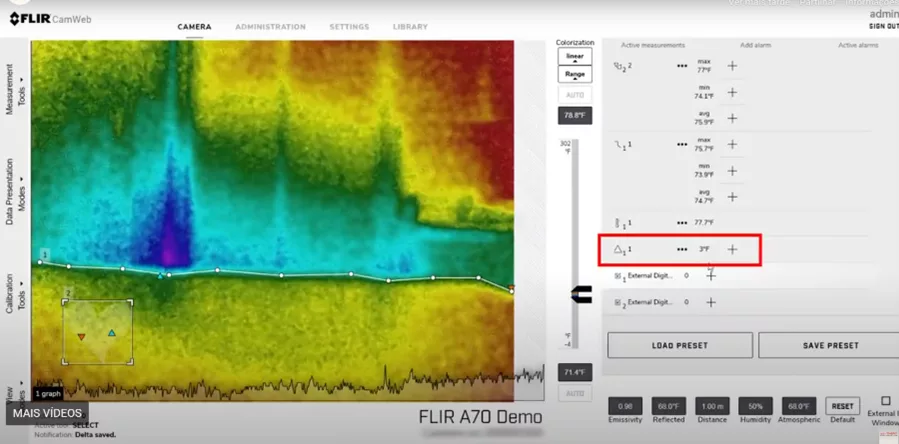
Thermal imaging assessment – Figure 9 – The delta tool
Below you can see a video about image analysis in thermography.
6 – Thermal imaging assessment – Level and amplitude adjustment
Level and amplitude can be adjusted using the bars below the image. You can also automatically adjust the scale and enter specific numbers for the maximum and minimum temperature., if desired.
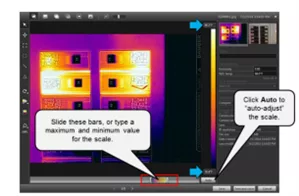
Thermal imaging assessment – Figure 10 – Level and amplitude can be adjusted
7 – Thermal imaging assessment – Distance correction (atmospheric) and emissivity
The emissivity, the reflected temperature and other object parameters can be adjusted in the table on the right of the image. These parameters have an impact on the accuracy of temperature measurements. Click Show all to display atmospheric temperature, humidity, distance and external optics parameters.
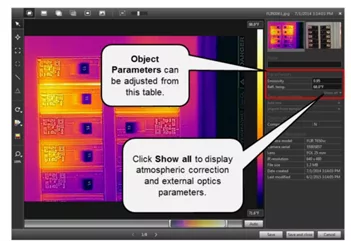
Thermal imaging assessment – Figure 11 – The emissivity, the reflected temperature and other object parameters can be adjusted.
8 – Thermal imaging assessment – Image interpretation guidelines
From the equipment point of view, The interpretation of thermal images is essentially a process of comparing temperatures and apparent surface patterns with reference images representative of the ideal reference criteria of reference, representative of the ideal criteria of conception, fabric, installation, Operation and Maintenance. This comparison may also be required before and after a maintenance activity.
Once the comparison and identification of any anomalies are completed, The analysis usually assumes the form of comparison of temperatures and patterns with those consistent with known failures and fault modes.
When using the thermography for purposes of MACHINE MONITORING MACHINES, It is necessary to know in detail the operating and environmental conditions of the machine at the time of each inspection, since many changes in thermal patterns depend on the operating conditions and/or the environment.
Understanding the design of an equipment is essential to understand the load of the components, which can be the main contributor to the thermal pattern. In a case, A normal load can generate an excessive temperature, while an acceptable temperature can be generated by an abnormal load application. A typical example of this situation is when the heat generated by friction in a load zone of a bearing is not excessive, But it is in the wrong place, indicating potential failures, as an incorrect assembly or misalignment of the traction unit.
When analyzing machine systems, It is necessary to adopt a thermodynamic approach combined with an analytical approach that considers the machine system as a whole and not as individual components. This thermodynamic approach considers the machine system from the point of view of heat production, heat loss and incident heat, as well as driving, Convection and Radiation.
The main examples include heat transfer along one place to a chumaceira from another heat source, that is, gears, SEAL SEALS/VAMP GLANDES.
The consideration of such sources, before determining the machine or component failure characteristics, ensures that the thermal balance of the machine is considered as a system and not as a specific failure of the component.
A typical defect identification process that can be used is specified in the ISO standard 18434-1.
Upon completion of this process, may also have to implement the following additional actions
- Apply a confirmatory analysis using an alternative technique, if necessary;
- Determine corrective actions.
9 – Thermal imaging assessment – Assessment of the severity of thermal anomalies
Absolute temperature
To determine the urgency of interventions, an analysis of the severity of the thermal anomalies found must be carried out.. Unfortunately, little is known about the relationship between temperature and time., for the occurrence of failures caused by high resistance on small contact surfaces. However, they can be taken as temperature limits and as initial analysis data., temperature values, in which metals (used in conductors and connections) oxidize, anneal or melt. For example:
- The temperature for copper should not exceed 80° C, because from this temperature, The copper oxidation rate in the presence of air increases rapidly and can produce an accumulative and excessive local heating in connections and contacts. Based on this fact, The Standards of the American Institute of Electric Engineers - AIEE and National Electric Manufacturers - Nema specify as Operation Limits, for discovered drivers, a temperature increase of 30 ° C above an ambient temperature of 40 ° C.
For many alloys used in conductors and connections, APPLICATION CAN OCCUR IF THE TEMPORTE 30 days. After prison, a change in the characteristics of the material occurs, With the loss of resistance, which considerably increases the likelihood of failures. Besides that, temperatures above 93 ° C, can degrade the compounds commonly used to protect the oxidation connections, accelerating the aging process and reducing the life of the connection.
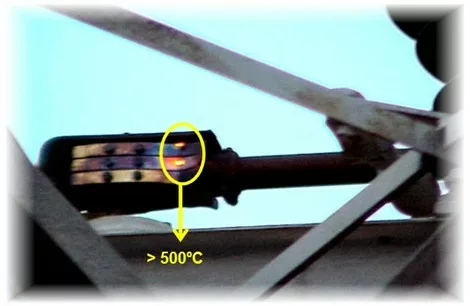
Thermal imaging assessment – Figure 12 - Evaluation by measured temperature
Relative temperature
Most international standards and guidelines base their criteria for evaluating the severity of thermal anomalies, In increasing temperature above a reference temperature (similar component and under the same load, DHit), or above ambient temperature (DAlso).
The table makes a comparison between some of the best known standards.
Table 1 - Comparison of severity criteria of some international standards.
| Severity | Ref. | Net1 (° C) | US NAVY2 (° C) | NMAC3 (° C) | Nuclear4 (° C) | CES5 (° C) |
| Low | ΔTref | 1 – 3 | 10 – 24 | 0,5 – 8 | 5 – 15 | 14 – 20 |
| ΔTamb | 1 – 10 | |||||
| Average | ΔTref | 4 – 15 | 25 – 39 | 9 – 28 | 16 – 35 | 21 – 60 |
| ΔTamb | 11 – 20 | |||||
| Alta | ΔTref | Na | 40 – 69 | 29 – 56 | 36 – 75 | |
| ΔTamb | 21 – 40 | |||||
| Criticism | ΔTref | > 15 | > 70 | > 56 | > 75 | > 61 |
| ΔTamb | > 40 |
- NET – NET MTS-2001, “Maintenance Testing Specifications for Electric Power Distribution Systems”, NETA – InterNational Electrical Testing Association,
- US NAVY – MIL-STD-2194 (SH) “Infrared Thermal Imaging Survey Procedure for Electrical Equipment”; Naval Sea Systems Command 02/1988;
- NMAC – Nuclear Maintenance Applications Center – Infrared Thermography Guide (NP-6973), EPRI Research Reports Center.
- Nuclear – Nuclear industry guidelines – (IR-F/H/V-200, Rev. 1); (Rogers, 2002).
- CES Guidelines – Overhead electrical wiring;
Still referring to the previous Table, the action to be taken and the deadline to execute it are defined as described below:
- Low Severity – Check at next scheduled maintenance.
- Medium Severity – Correct at next scheduled maintenance.
- Severity – Urgent intervention observing the operational restrictions of the System.
- Critical Severity – Immediate intervention.
The application of the standards mentioned above must be done with caution, when in substations in open environments, seen that, severity criteria are based on temperature readings (Delta T) and do not take into account the various known influences. Therefore, can lead to erroneous analyzes and wrong diagnoses.
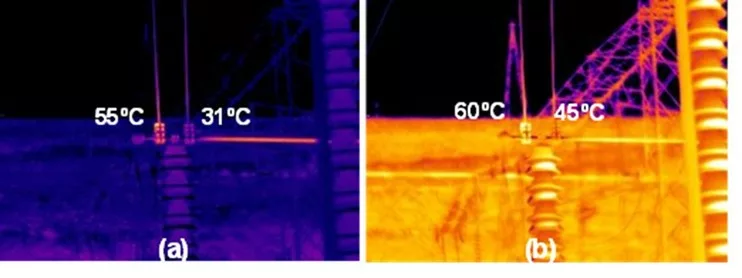
Thermal imaging assessment – Figure 13 – Assessment by relative temperature
10 – Thermal imaging assessment – Intervention decision flow
There is a method that uses several questions, directed to the thermography inspector, whose purpose is to evaluate, through the answers provided, the severity of thermal anomalies depending on the various factors relevant to a thermographic inspection. From this assessment, the action to be taken and the deadline for carrying it out are defined. Based on this method and focusing on high voltage substations, in open environments, the following questions were asked.
State 1
- There is visible heating or obvious melting?
- The absolute temperature is greater than 93° C? (Measurements made on high-emissivity surfaces close to the heating source).
- The delta T between the thermal anomaly and a reference temperature (similar component and under the same load, ΔTref) is greater than 35° C? (Measurements made on high-emissivity surfaces close to the heating source).
- The heating is of internal origin and the delta T between the thermal anomaly and the reference temperature (similar component and under the same load, DHit) is greater than 10 ° C? (Connections within oil devices, lightning, pressed connectors, etc.).
If any of the questions have a positive answer there is a high probability of failure and the actions to be taken can be:
- Intervene.
- Monitor the component continuously until intervention is possible.
If none of the questions have a positive answer, the thermography inspector answers the state 2.
State 2
- The delta T between the thermal anomaly and a reference temperature (similar component and under the same load, ΔTref) is greater than 10 ° C? (Measurements made on high-emissivity surfaces close to the heating source).
- There is a possibility that the load current double before repair?
- The emissivity of the component is very low?
- The wind speed is higher than 10 km/h? (Wind speed measurements made near the anomaly).
- There is a history of failures for this component?
- The component is subject to a severe work cycle? (Excessive vibration, dust, pollution, corrosive agents or load oscillation).
If two or more questions, have positive response, The thermal anomaly is classified with having a moderate probability of failure. In this case an evaluation by the maintenance or substation management, will help define what action should be taken.
The following questions help in this task:
- There is a great risk of personal accidents if the failure occurs?
- What is the importance of the equipment / circuit for the system at the present time?
- There is a possibility of reducing the risk of failure through circuit maneuvers and/or decreased load current?
- There are personnel and spare parts available for repairs within the period established for the intervention?
Based on responses, actions can be:
- Intervene urgently while observing the System’s operational restrictions.
- Correct at next scheduled maintenance.
- Monitor the component periodically until repair is possible.
- Run other diagnostic tests.
- Reduce component charging current.
State 3
If one or no questions from the State 2 have a positive response, the anomaly is classified as having a low probability of failure and the actions may be as follows:
- Correct at next scheduled maintenance.
- Check at next scheduled maintenance.
- Run other diagnostic tests.