Vibration analysis bearing
1 – Vibration analysis bearing
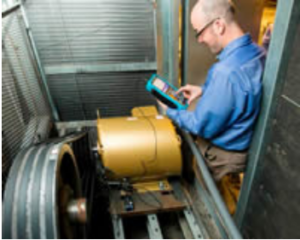
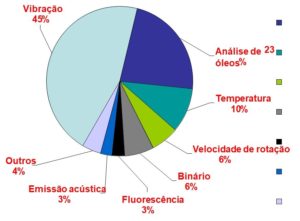
The bearings are a unique component that most concerns and give work to a mechanical maintenance and it follows the importance of Vibration Analysis bearing. Are common industrial units with components of this type installed by the thousands. Like this, one of the main objectives of a machinery condition monitoring system in an industrial plant which is to know the status of bearings. shown in the following figure can be seen the techniques used to bearing condition monitoring.
The general problem of bearing failure detection with the vibration measurement is how to separate the low-amplitude vibrations produced by the collision of the rolling elements, the roll a well lubricated surface, with the edges of a slit undetectable to the naked eye, other machine vibrations. This can be done with a vibration analyzer.
2 – Physical characteristics of bearings
Below you can see a video on this topic..
3 – Vibrations generated by a bearing in degradation
To understand how to operate the various techniques of detection and diagnosis of faults in bearings that there is to know the characteristics of vibration to which these phenomena give rise.
Consider the case of a breakdown rolling fatigue effect. This is the case of some 80% Bearings that fail.
1Th stage of degradation of a bearing
By the effect of fatigue phenomena microcracks are produced by low bearing surface. It bursts instead of vibrations at very high frequencies (between 100 e 300 Kilohertz) which are called Acoustic Emission. Typically these vibrations are lost in the machine background noise.
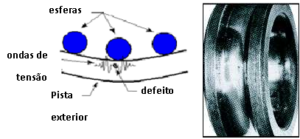
Figure 1 - First stage of degradation of bearings
Later, As the wear progresses, the lower frequency range to 20 a 60 KHz. These frequencies are detected by the face detection techniques for high frequency vibrations in (Ex: HE, HFD, Shock Pulse, PeakVue, etc.).
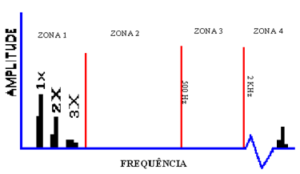
Figure 2 – Phase degradation of the bearings in the frequency spectrum
At this stage normally left 10 a 20% the remaining bearing life.
2Th stage of degradation of a bearing
The microcracks reach the surface of the track.
The edges of the slit are sharp. They occur when the impacts they produce shock waves very abrupt. The vibrations produced are very small and less than the background vibrations produced by the machine up to a few kHz.
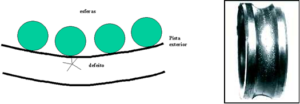
Figure 3 - 2nd bearing degradation phase – The microcracks reach the surface of the track.
Shocks begin to excite the natural frequencies of the areas impacted, that often arise sidebands modulated by the bearing rotation speed, accelerating the spectra.
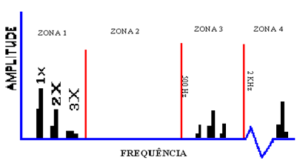 Figure 4 - 2nd stage degradation of bearings - the frequency spectrum
The amplitude of the vibrations at high frequencies (zone 4) rooms. At this stage normally left 5 a 10% the remaining bearing life. It is time to recommend the change bearing.
3Th stage of degradation of a bearing
The slit increases and the successive impacts of the rolling bodies round their edges. The vibration amplitude increases at low frequencies.
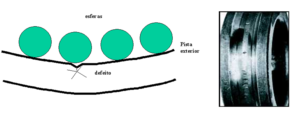 Figure 5 - Stage 3 of bearing failure – The gap increases
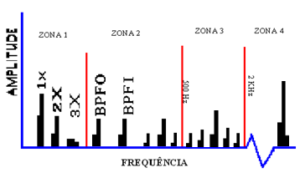 Figure 6 - 3rd phase fault in the bearings - the frequency spectrum
Emerge clearly harmonic frequencies of the characteristics of bearing defects. The more advances the further degradation is content in low frequencies and number of harmonics and sidebands.
The amplitude of the vibrations at high frequencies (zone 4) continues to rise. At this stage normally left 1 a 5% the remaining bearing life. When you open the bearing defects are already clearly visible and it is urgent to remove the service rolling.
4Th stage of degradation of a bearing
The degradation of the track surface becomes significant. The starting material has the effect, completely round the edges of the fissure.
In the final stage of degradation to the component rotational speed (1x) may rise as a result of occurrence of the gap; these conditions arise numerous harmonics.
The degradation of the geometric characteristics of the rolling means that the frequency characteristics disappear and emerge "a mountain" in the spectrum without any frequency in the spectrum well marked. The spectrum of grass level also increases due to the shocks that occur are.
The vibratory effect can be detected in the medium frequency, and end at low frequencies (frequencies below 1 KHz).
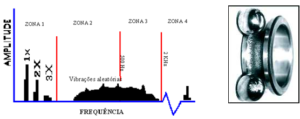 Figure 7 – 4Second phase - the bearing loses the geometric characteristics
At this stage the level of vibration in Zone 4 may decrease. At this stage normally left 1 hour – 1% the remaining bearing life.
It has been so in these circumstances for a bearing, in the early stages of decay the vibrations produced by the degradation are bearing of very small extent and only above the background noise produced by the environment in which the bearing is located at high frequencies. As the degradation evolves the amplitude of the vibratory phenomenon increases, and the frequencies that they can be detected smaller and smaller.
In cases of bearings to rotate at low speeds (tens or hundreds of revolutions per minute) the vibrations produced are reduced amplitude, thus presenting the detection of these faults, greater difficulties. The lower the rotation speed, the smaller the amplitudes of the vibrations produced.
Below you can see a video on assessing the severity of defects in bearings.
4 – fault detection techniques for analysis of vibrations in bearings
The detection techniques must comply with various requirements:
- Give a notice of reasonable time before the breakdown by stop;
- There is a significant difference between the amplitudes measured in a roll good and bad conditions;
- Be simple to implement.
come so, various detection techniques, each with advantages and disadvantages.
There have been techniques used most commonly as, the following:
• Global Level Measurement of Vibrations (10 Hz – 1 KHz)
• Measurement of High Frequency (Bigger than 1 KHz)
• Frequency Spectrum Analysis
• Analysis of Envelope
For bearings rotating at very low speed, unless 20 RPM, vibrations are not appropriate technical control condition not have adequate sensitivity.
For this range of speeds the proper technique is the acoustic emission.
5 Global Level Measurement of Vibrations
The simplest way to detect a deterioration of a bearing is through regular measurement of Global Vibration level in the respective bearing. This technique is based on measuring the average quadratic (RMS) the level of vibrations in a wide frequency band. The measurement of acceleration gives the best results. These measurements can be made using an accelerometer, and a portable measuring vibrations with a suitable filter incorporated. The measurement results are compared to standard values or standards established for each bearing. graphically presenting the results of the measurements over time can easily follow the trend of evolution and its future extrapolated to predict whether when is the bearing needs to be replaced. However, and because it is often, the vibration level of a degraded bearing only rise in the last phase of the fault, this method gives a late notice, especially for bearings to rotate over a thousand revolutions per minute.
In slower bearings such as, for example running between 150 e 600 RPM, the application of this technique gives satisfactory results. The fact that the rate of evolution of a fault is much slower in a bearing that functions in said speed range than in the functioning 1500 RPM, gives this technique in these circumstances give a satisfactory pre-warning time.
Bearing to rotate at even lower speeds, this technique loses sensitivity.
It has thus the following advantages and disadvantages:
- Benefits
– Quick
– Simple
– Economic
– Results with one number - Disadvantages (bearing rotating at more than 1000 RPM)
– Only detects some faults
– Detects malfunctions at a late stage - Disadvantages (bearings for rotating at least 150 RPM)
– insufficient sensitivity
6 – Measuring the overall level of vibrations at high frequencies
Bearing the run up 600 RPM most expeditious method of detecting faults in bearings is by measuring vibrations at high frequencies, produced by degradation in rolling.
Currently exist in several meters of vibrations market, with this possibility and thus to detect malfunctions in the bearings.
In the most widely used is an accelerometer transducer, containing the meter itself a filter that passes only a particular frequency range of the vibrations measures, followed by the treatment of a measurement signal and the amplitude.
The Crest Factor and analysis of vibration in bearings
Next for illustration effect refers to one of these techniques, O “Crest factor”.
The Crest Factor is the result of dividing the peak value and the RMS value of vibration.
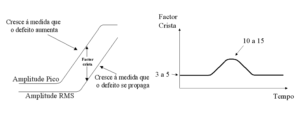 Figure 8 - The crest factor
The curves in the figure above shows a typical evolution of Crest Factor as the operating condition of the bearing deteriorates. Initially, there is a relatively constant ratio between the peak value and the RMS value. The peak value will grow normally until a certain limit. As the bearing deteriorates, more pulses will be generated for each passage of the balls, ultimately influencing the RMS values, even though the individual amplitude of each peak is not greater. By the end of bearing life, Crest Factor may have gone down to its original value, even, However, peak and RMS values have grown considerably. The best way to present the results of the measures is presented; the Peak and RMS values on the same graph, Crest factor with the deduced from the difference between the two curves.
The filtering of the vibrations at high frequencies and vibration analysis in bearings
In the following figure we see the effect of filtering the vibrations below 1 KHz. The rise of Crest Factor” It becomes the effect of filtering the signal, much more noticeable.
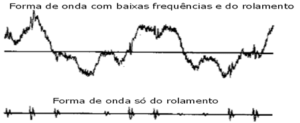
Figure 9 - Filtering of vibrations at high frequencies
As it can be easily inferred from that stated above, methods of detection of bearing faults through measurements at high frequencies, start from two principles:
• When a bearing breaks down are produced vibrations at high frequencies
• The only existing vibrations at high frequencies are produced by a degraded bearing
measurement limitations of the overall level of vibrations at high frequencies
In everyday life are many situations where this is not true, where the limitations of such measures.
The first limitation relates to the fact that this technique for bearings lose sensitivity to rotate at speeds below 1000 RPM, and be of questionable effectiveness at lower speeds 600 RPM. Actually this speed range no longer produce shock vibrations at high frequencies as described above.
The second limitation is the fact that high frequency vibrations are rapidly damped in materials and its amplitude is drastically reduced by the separation between the surfaces of machine components. It is thus that the measurement point is not located in proximity to the rolling technique loses sensitivity, or even crashes.
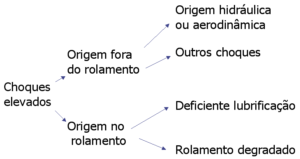
The third limitation comes there may be other sources of vibration at high frequencies.
The inferred immediately scheme between the result of the high frequency measurements indicate high amplitudes and to say that a bearing is degraded goes a long way.
Phenomena from outside of bearings that can generate vibrations at high frequencies are different:
• Cavitation
• aerodynamic phenomena
• Shocks gear in poor condition
• Shocks loose parts
• Etc.
If the vibration originates in the bearing, still yet, it may be that he is not in poor condition. If the lubricant is not being done under suitable conditions will occur in the lubricant film breaks, you should separate the rolling elements of the tracks, that will give, therefore, place the occurrence of shocks such as would occur if the bearing was run down.
They are thus the following advantages and disadvantages of this technique (bearing rotating at more than 1000 RPM).
- Benefits
• Quick
• Simple
• Economic
• Results with one number - Disadvantages
• Measure point is Critical
• Subject to interference from other sources
7 The frequency spectrum of the vibration analysis in bearings
During stages of degradation in which the impacts occur between the rolling elements and the bearing races will be excited natural frequencies of the bearing components.
Each time the rolling element find a discontinuity cause a vibrating pulse.
The frequency characteristics of defects in bearings in vibration analysis
The resulting vibration will consist of a periodically repeated series of pulses at a rate determined by the location of defects and the bearing geometry. These repetition rates are known to characteristic frequencies of bearings. More specifically, the Ball Pass Frequency on the outer track (BPFO) to a defect in the outer race; the Ball Pass Frequency on the inside track (BPFI.), to a defect in the inner race; the frequency of rotation of the ball (BSF), for a defect in the spheres; or cage frequency (FTF) for a defect in cage. The frequency characteristics of defects in the bearings can be calculated from the bearing geometry of formulas that can be seen below. Note-se, Yet, these formulas assume a perfect rolling motion, while in reality there is always some slip. Like this, the equations should be considered approximate.
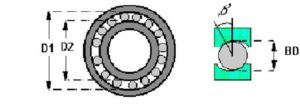
Figure 10 - geometrical characteristics of relevant bearings for vibration analysis in bearings
if having that:
n = number of rolling bodies
fr = frequency of rotation
![]()
Frequencies defect characteristics are bearing:
a) Frequency of defects in the outer race
![]()
b) Frequency of defects in the inner race
![]()
c) Rotation frequency of rolling elements
![]()
d) Cage rotation frequency
![]()
The value of the frequencies of the bearing components and the structure in which it operates, They are not affected by frequency or its impact strength. The bearing resonances generally occur in the area between 1 KHz e 20 KHz, occurring in frequency bands.
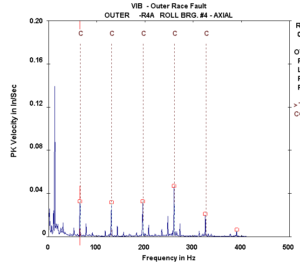 Figure 11 – Faults in the bearings produce harmonic components of the frequency characteristics of defects
In the previous figure can be seen the difference in the frequency spectrum of the isolated effect of impact on a structure and an effect that repeated impacts is what happens when a fault occurs in a bearing.
They are thus the following advantages and disadvantages Frequency Spectrum Analysis, as fault detection technique bearing:
Benefits
• Detects malfunctions in bearings running at low speeds
• Provides information on the frequency of vibrations, which can be used for diagnosis
Disadvantages
• Increased Investment
8 Envelope Analysis the bearing vibration analysis
The envelope analysis is, currently, the tool par excellence, for detecting faults in bearings Vibration analyzers. It has also become essential to diagnose any mechanical problems that can lead to shock, such as gears in poor condition, days off, desapertos, etc.
Originally, when it was developed did not have the ability to measure, with accuracy, the level of acceleration generated by mechanical impacts, but, since the nineties, with the development of detection technology impact peaks, this limitation is exceeded.
The envelope with vibration analysis techniques have had various commercial designations and, namely:
- PeakVue (Emerson/CSI);
- Espectro de Spike Energy (IRD/ENTEK/Rockwell Automation);
- demodulation;
- Envelope;
- Etc.
However despite the different names and how to implement, all continue to provide envelope analysis versions.
8.1 Impact measurement and signal analysis
The bearing damage arise in terms of vibrations on how well evident in the waveform shocks.

Figure 12 - Pulse vibrations generated by shocks
these impulses, of very short duration, They are well detected with a vibration meter with peak detector.
1th Rule - To monitor the progress of impact spikes is necessary to correctly measure the peak amplitude of the waveform
Let's imagine that a bearing to rotate at low speed we want to measure a spectrum up 100 Hz. For this, typically, the analog-digital converter of a spectrum analyzer will get a waveform sampled the 2,56 x 100 Hz = 256 Hz, that is, the waveform will consist of samples obtained from 4 in 4 ms, which is completely insufficient to adequately measure the peak amplitude of the shocks.
In the following figure one can see an example of a waveform with an insufficient number of samples and that its scope is not adequately characterized.

Figure 13 - sampling the waveform by the analog-digital converter
To adequately characterize a shock that lasts less than one millisecond have to take at least 10 samples per millisecond, for example. we have, therefore, in order to properly characterize the amplitude of a pulse which is last one second will require a sampling frequency 10 KHz, which corresponds to a maximum frequency of the spectrum 4 KHz.
2th Rule - Even if the bearing is of low rotational speed range of the end frequency must be high
If this rule is not followed amplitude which appears on the waveform and the spectrum is not real.
Now, a low rotational speed of the bearing defect frequencies are in the order of a few Hz and has, therefore, to obtain high-resolution spectra, with a high number of lines, such as e.g. 3200.
3th Rule - To see the frequencies defects characteristics have to use high-resolution spectra
All that referred to the frequency spectrum analysis is also valid for the envelope analysis.
As it is known, to adequately characterize the vibrations of the bearings should be removed from the other first low frequency vibrations on the machine. This is usually effected by envelope detection.
8.2 - Diagram envelope analysis blocks
This is the traditional scheme envelope analysis.
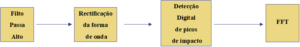
Figure 14 Block diagram of the traditional envelope analysis
What is intended is what you can see below.
a) Shape before the high pass filter.
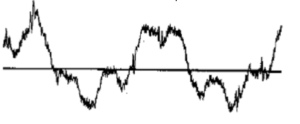 Figure 15 - waveform before the filter
b) Waveform after filter.
 Figure -16 Waveform after filter.
c) Signal after rectification (red).
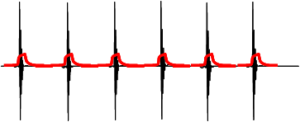
Figure 17 – Signal after rectification (red).
In the analog-digital conversion limitations are the same as in the analysis of the traditional spectrum.
Below you can see a video about demodulation of bearing vibrations.
8.3 – The envelope amplitude of the bearing vibration analysis
As shown in the figure above the traditional envelope can not accurately measure the amplitude of very short duration events.
The analog filters normally used has a delay in response time which prevents them from making precise measurements of pulses.
This is why many manufacturers inform the amplitude envelope of the spectral components is unreliable, and this can only be used for diagnostic purposes.
Since then measuring the peak amplitude of the envelope waveform?
Is there a way to have a spectrum envelope amplitude with proper components?
8.4 – Correct the peak amplitude of the envelope waveform measurement in bearing vibration analysis
There are two ways:
• A traditional; using a peak amplitude detector. Measurements of the peak amplitude of the waveform give correct results, but the amplitude of spectral components is not.
• The most recent; first sampling the waveform at a high frequency (for example 100 KHz), regardless of the maximum spectrum frequency, to ensure that it correctly detects the extent of the impact of peaks. Then these samples are used to reconstruct a waveform that will serve the construction of the frequency spectrum. This reconstructed waveform retains May each sample value of all samples that gave rise to. This technique is used by CSI and SVD.
Below follows a block diagram thereby envelope analysis.
Figure 18 - Diagram of the envelope detection block for a correct measurement of the peak amplitude of the envelope waveform
With this approach the amplitude of peaks in the waveform and spectral components is the correct.
 Figure 19 - Measurement of the correct peak amplitude of the wave form of the envelope
Next you can see an example of application in a bearing in an electric motor. O spectrum Normal, the above, shows defect symptoms in inner race, unclear. The spectrum envelope, below, shows clear symptoms of defects in the inner race.
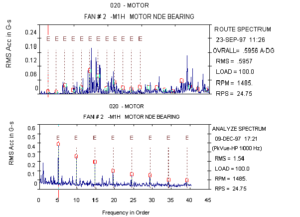 Figure 20 – O spectrum Normal, the above, shows defect symptoms in inner race, unclear. The spectrum envelope, below, shows clear symptoms of defects in the inner race.
9 – other techniques
9.1 The Acoustic Emission and analysis of vibration in bearings
Acoustic Emission Technology is a nondestructive test method used in a wide range of industrial applications to detect and locate defects on mechanically loaded samples. The acoustic emission was formally defined as “the class of phenomena in which transient elastic waves are generated by the rapid release of energy from localized sources within a material, or transient elastic waves thus generated”. such waves, usually, take the form of high level of tension band waves and broad frequency that, to be measured, They are received and converted into electrical signals by piezoelectric transducers.
To learn more about the application of this technique in the control condition of low speed bearings click on here .
9.2 The ultrasonic measuring and condition monitoring of bearings
The ultrasonic measurement is another technique that is also effective in controlling the condition of bearings. In most circumstances it is more practical to use the measurement of vibrations because it simultaneously measures the severity according to ISO. However there are circumstances where it is more practical to use ultrasound to monitor the status of bearings, of the vibrations.
When you have to measure many tens of equal bearings, small dimensions, wherein the evaluation of the severity of the vibrations in accordance with ISO is irrelevant, ultrasonic measurement is more practical than measuring vibrations. These circumstances are those of the following machines bearings:
- Bearing roller bearings of belt conveyors belts;
- spindle bearings spinning machines in the textile industry.
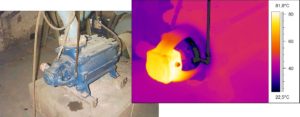
9.3 thermography
The measuring temperature is an essential technique for monitoring the condition of bearings.
10 – practical case Vibration Analysis bearing
several case studies here are presented in Vibration Analysis bearing.
Case 1 – Vibration Analysis cooling cylinder support bearings
Technical Services of DMC were asked to evaluation of the operating status several cooling cylinders support bearings, a printing rotary. Your request took place after been a catastrophic failure, one of the cylinders, due to the seizure of a bearing, which gave rise to the shaft of a cylinder was gone. It should be noted that the machine was in warranty period, having its entry into operation occurred less than one year.
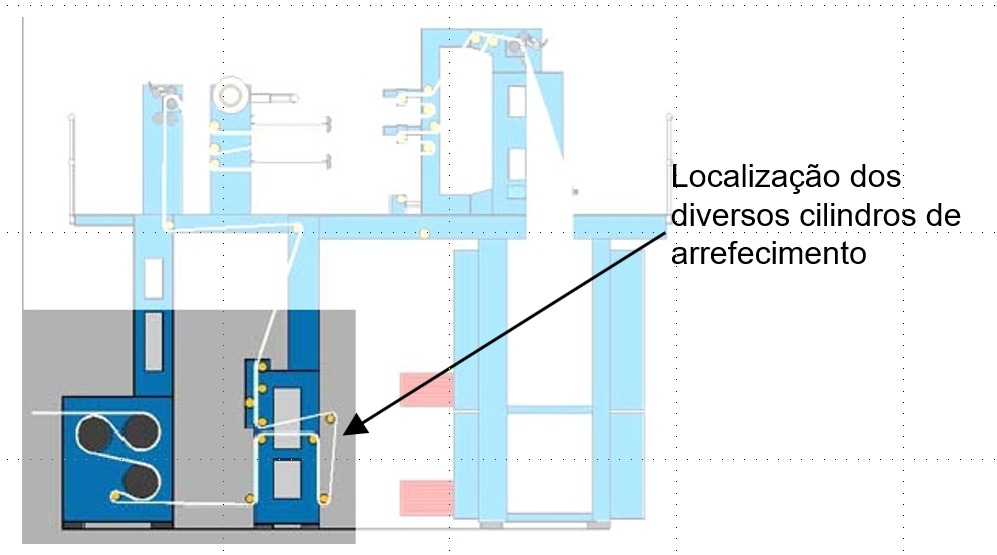
measurements were made in support of 10 cylinder, wherein the installed bearings are presented below:
|
Bearing ref |
Cylinder |
|
SKF 4211 |
Nº1 |
|
FAG 1211 |
Nº2, Nº3, Nº5, Nº6, Nº7, Nº8, Nº9, Nº10 |
|
SKF 2211E |
Nº4 |
Case 1 - the first measurements results
The analysis of the collected data revealed the presence vibrométricos frequency associated with developmental abnormalities, in almost all of the cylinders support bearings. Only in support of the cylinder 4, Cilindro Nº8 Cilindro Nº10, It did not identify the presence of these frequencies. It should be noted that the roller bearings 8 had a working week, since the previous flu had originated and catastrophic failure of the machine.
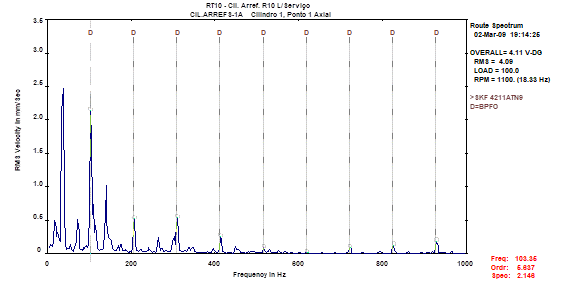
Figure 22 - vibrations frequency analysis on the collected -Espectro bearing support cylinder 1 revealing the presence of frequency associated with development abnormalities in the outer ring raceway of the bearing installed (103,35 Hz).
Case 1 - Recommendations made and further measurements
In view of the results obtained, It was recommended the replacement of the bearings supporting cylinders 1, Nº2, Nº3, Nº5, Nº6, Nº7. In the figure 23 Frequency spectra are presented collected, before and after replacing the roller bearings 1, where you can observe the disappearance of defective bearings frequencies.
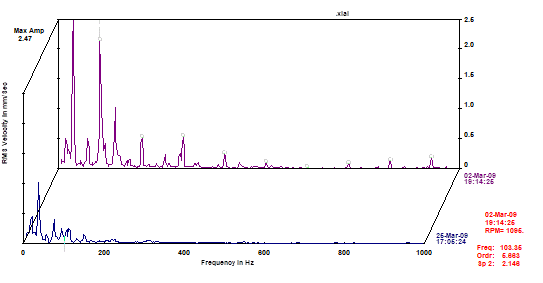
Figure 23 - Vibration Analysis -Espectros bearing frequencies collected before and after replacing the cylinder # 1 PeakVue support bearings support the shaft collected client, the drive side, collected inspection May 2007.
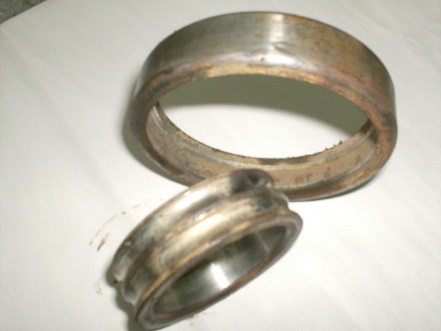
Figure 24 - Vibration Analysis bearing – Photography of one of the bearings replaced, revealing severe oxidation and degradation of the components of the runways.
Case 1 – Conclusion
The measurement and analysis of vibration is a powerful inspection technique and useful in the detection and diagnosis of faults. Even in new equipment, this technique allows us to identify and diagnose faults early in development, originated, for example, by problems in the assembly, design problems, Poor storage of parts and components, etc.
Case 2 – Vibration analysis bearing – failure in a bearing of an electric motor 1200 kW
After the intervention for improvement, a motor 1200 KW operating at 600 rpm, He began to develop an uncharacteristic noise. The caretakers chose to take a measurement of vibrations. The collected values listed in Table I below presents:
|
Measuring point |
Vibration level in mm / s RMS |
|
1 Vertical (L. actuation) |
19,1 |
|
1 Horizontal (L. actuation) |
3,9 |
|
2 Vertical (L. On. actuation) |
1,4 |
|
2 Horizontal (L. On. actuation) |
0,9 |
|
2 Axial (L. On. actuation) |
8,3 |
For analysis of the values presented in Table I, It is noted that higher values are recorded at the point 1, in particular point 1 Vertical. The frequency spectrum analysis collected revealed that high levels of vibration (19,1mm/s) they were, about everything, influenced by the amplitude of the frequency 112.21 Hz and harmonics. This characteristic shown in Figure 25, It is associated with the bearing degradation.
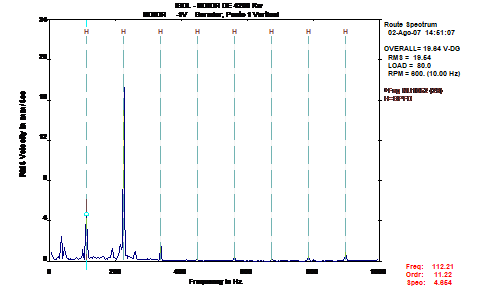
Figure 25 - Vibration Analysis bearing – frequency spectrum collected in the engine, Score 1 vertical
Case 2 - Recommendations made and further measurements
Depending on the values obtained, It was to replace the motor bearing recommended.
After replacing, a new measurement was made vibrations. The values recorded are listed in Table II.
Table II
|
Measuring point |
Vibration level in mm / s RMS |
|
1 Vertical (L. actuation) |
1,7 |
|
1 Horizontal (L. actuation) |
1,2 |
|
2 Vertical (L. On. actuation) |
1,6 |
|
2 Horizontal (L. On. actuation) |
1,4 |
|
2 Axial (L. On. actuation) |
4,3 |
For the comparative analysis of the values presented in Table I and II, It follows that the values recorded in the second measurement (Table II) They show a very significant reduction, as a consequence of the replacement bearing.
In the figure 26 It presents the collected spectra after intervention, which is quite noticeable the improvement.
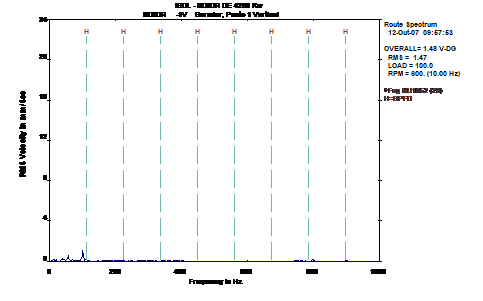
Figure 26 - Vibration Analysis bearing – frequency spectrum collected in the engine after replacement support bearing
Case 3 – Vibration analysis bearing – failure in the bearing cage blower
In the first routine measurement made to a fan (transmission belts), it was found that the spectrum collected at the support bearing of the fan impeller, side pulley, presented the frequencies associated with the bearing cage degradation.
Values were considered low in the presence, As can be seen in the spectrum shown in Figure 27. However, this type of damage, normally it does not exhibit high frequencies with amplitudes, due to the speed at which the cage wheel is also low. For the type of fault and the criticality of the equipment within the production process, It was recommended the replacement of the respective bearings. When bearing disassembly, it was found that the cage was in fractured in several places.
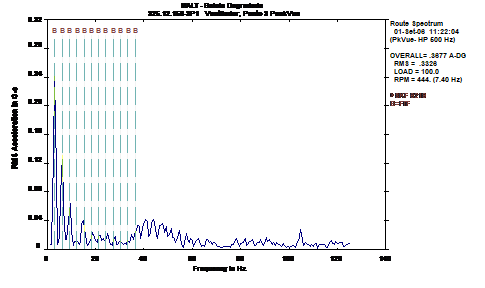
Figure 27 - Vibration Analysis bearing – frequency spectrum collected on the fan support before replacement
By measuring vibrations, Could timely and without loss of production involved in the equipment and minimize the intervention costs.
Case 4 - Vibration Analysis bearing – electric motor
An electro-stirrer, constituted by a gear motor that drives an agitator, whose engine works 1498 rpm and the stirrer 133 rpm, It is included in a Predictive Maintenance Program, It is therefore subject to regular inspections vibrométricas.
Vibrométricos the data collected in the last two inspections in supporting the agitator, They revealed a worsening of the global parameter PeakVue, as can be seen in the trend chart shown in Figure 28.
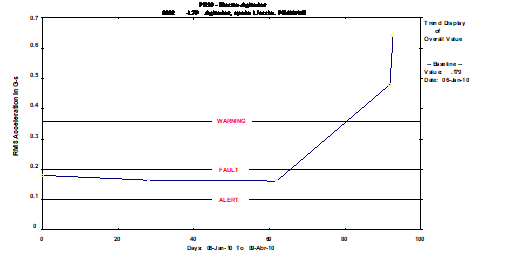
Figure 28 – Vibration analysis bearing – the global trend graph PeakVue parameter
The analysis of the spectra PeakVue registered in the last two inspections, revealed that the increase registered in the overall levels, He was associated with the presence of frequencies associated with developmental abnormalities, the outer ring raceway of the bearing installed, As can be seen in Figure 29.
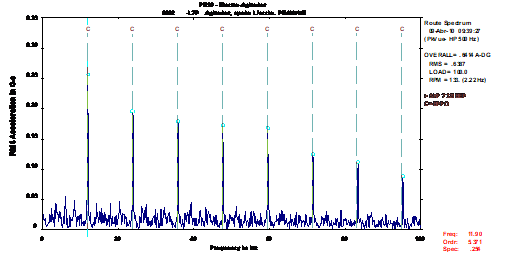
Figure 29 – Vibration analysis bearing – PeakVue spectrum recorded in the last inspection performed
In order to better observe the drastic alteration of "characteristic" spectral occurred over the last inspections, is shown in Figure 30, the history of PeakVue spectra recorded in support of the stirrer.
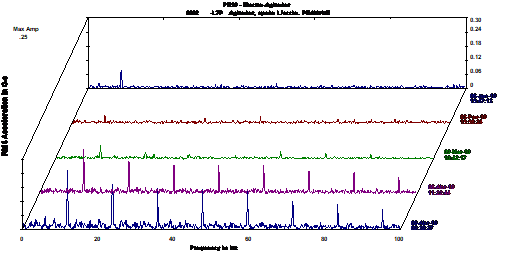
Figure 30 – Vibration analysis bearing – PeakVue spectra recorded during the various inspections
Given the diagnosis made, It was recommended to replace bearings within the scheduled stop stirrer installation.
After replacing the bearing of the stirrer (see photo bearing replaced), the overall level of PeakVue, and the characteristic of the spectra, revealed a dramatic change.
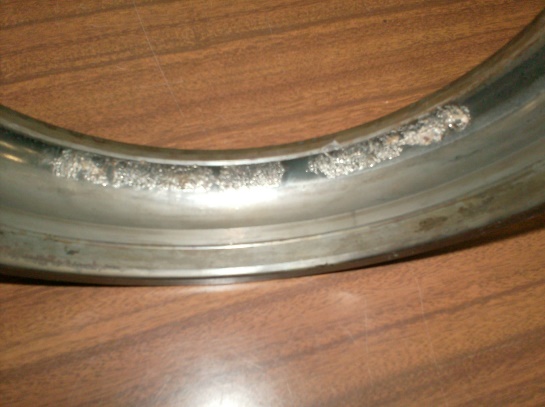
Figure 31 – Vibration analysis bearing – Photograph showing the outer ring raceway of the bearing replaced
Case 4 – Vibration analysis bearing – Conclusion
The parameter PeakVue It has proved to be an excellent tool for the detection and diagnosis of faults in low-speed bearings, as it proved in this case with a bearing that worked to 133 rpm.
Case 5 - Vibration Analysis bearing – celectric motor quality ontrol
A new engine, of 5200 Kw, It was subjected to a quality control through the Vibration Measurement and Analysis. The values recorded in the overall levels of vibration appear in Table I below presents.
|
Measuring point |
Global Level value of vibration in mm / s rms |
|
1V (Engine Opposite Side to Drive – Vertical direction) |
0,3 |
|
1H (Engine Opposite Side to Drive – Horizontal direction) |
0,5 |
|
2V (Motor side of Drive – Vertical direction) |
0,3 |
|
2H (Engine Opposite Side to Drive – Horizontal direction) |
0,6 |
|
2X (Motor Drive side - Axial Direction) |
0,8 |
Analyzing the figures presented, it appears that the motor is to work with vibrométricos levels considered as "Good", in accordance with ISO 10816 Part 1.
The global value of higher vibration was 0,8 mm/s rms, registered in the axial direction.
However, the analysis performed in the spectra PeakVue have identified the presence of frequency 187,69 Hz and harmonics. The presence of this frequency is associated with abnormalities in the installed bearing (Refª SKF NU1048), in particular the outer ring raceway.
Yet, The recorded amplitudes are characteristic of an initial stage of development abnormality, As can be seen in the spectrum shown in Figure 32.
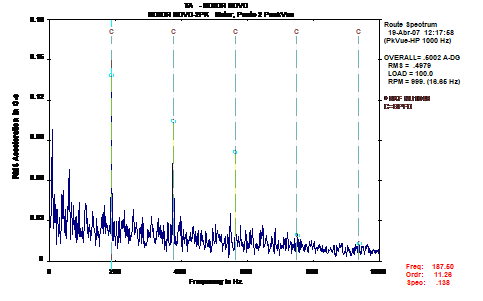
Figure 32 - Vibration Analysis bearing – PeakVue spectrum collected in the engine, the drive side
Having identified the type of fault, the characteristics of the equipment / rolling, as well as the amplitudes recorded, It was recommended monitoring the diagnosed anomaly, with suitable means.
The use of vibration measurement and analysis of quality control in new or repaired equipment, allows timely diagnose the abnormality, and thereby, charge the costs of any replacements of organs, the respective supplier, during the warranty period.
Case 6 – Vibration analysis bearing –Abnormal noise in an electric motor
an engine, considered critical for the production process, It was subject to intervention to replace the bearings, due to the noise that produced, when in operation.
After replacing, it was found that that noise was kept unchanged. Those responsible for maintenance pondered the possibility to again replace the respective bearings.
Since this company did not have an implemented predictive maintenance program, We were prompted us to the vibration measurement device in order to assess the engine operating condition, and, consequently, the noise source (supposedly anomalous).
Case 6 - Measurement results
The measurement is performed it found that the engine ran at a speed of 1194 rpm (19,9 Hz), which led to deduce that this engine could have a variable speed drive.
The next engine noise was noticeable even without stethoscope. The analysis performed and the spectra obtained, in particular, the spectra PeakVue (Figure 33), They revealed the presence of frequency 81,39 Hz and harmonics, corresponding to order 4,090. At first glance and for the analysts less attentive, This feature could be associated to the degradation of(s) bearing(s).
However, given that the variable speed drives the motor induce an equivalent frequency to four orders of the operating frequency (with harmonic), Frequency presence of 81,39 Hz was not associated with abnormalities in bearings, but yes, a feature of the normal operation of the machine, with a variable speed drive.
The variable speed drives with motors can mislead less attentive because analysts, if this engine has a bearing on the type 6210 when FAG, the typical frequency of defects of the outer ring raceway will be 4,072 instructions, corresponding, approximately, the frequency generated by the variable speed drive (in this case 4,090 instructions). This approach may take the values analysts unnecessarily recommend replacement of bearings, since the frequencies are nearly coincident.
Case 6 – Conclusion
Bearing replacement just because of the noise may be a bad option; in this case, the substitution in vain.
There is no guarantee that a noise, à anomalous departure, It may be associated with an abnormality.
The speed drives generate noise that varies according to the speed at which the motor operates, which sometimes induces operators in error.
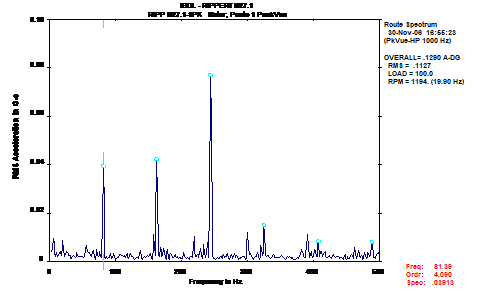
Figure 33 - Vibration Analysis bearing – Spectrum collected in the engine
Case 7 – Vibration analysis bearing –Pulper
During a routine inspection, DMC was requested to perform the measurement of vibrations in a pulper, due to the presence of an uncharacteristic noise.
The Pulper works 238 rpm and has the identical configuration to that of Figure 34. The measuring points were defined as can also be seen in the same figure.

Figure 34 — Vibration analysis equipment bearing a diagram of the identification of the measuring points
Case 7 - the first measurements results
After making the measurement, it was found that the measuring point 3 (Pulper support pulley side), values recorded undergone a significant change, compared to the previous measurement. This change has resulted in a significant worsening levels vibrométricos (Figure 35).
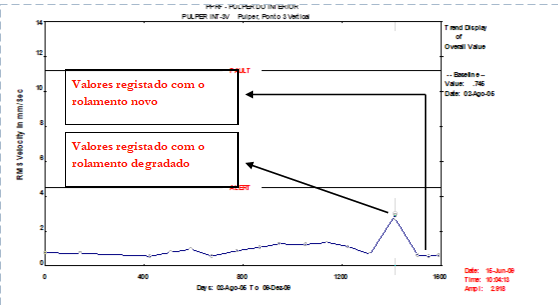
Figure 35. Analysis of vibrations in bearings – trend graph of overall vibration levels values recorded along the inspections carried out
Analyzing the spectra collected in support of the pulley side Pulper, it was found that the deterioration of recorded vibration levels were, about everything, influenced by the amplitude of the frequency 33,39 Hz and harmonics.
According to the technical information obtained, the bearing would be installed FAG 23228EAS.
Like this, and having regard to Figure 36, easily conclude that the greatest damage are located in the bearing outer ring (BPFO), since the defect frequencies outer ring coincide with the frequencies present in the frequency spectrum.
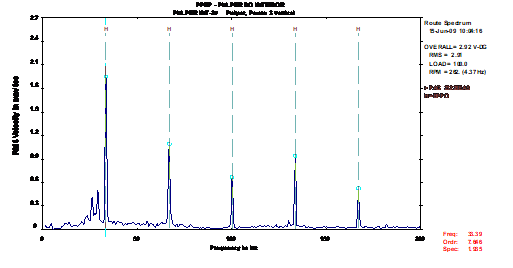
Figure 36 Analysis of vibrations in bearings - frequency spectrum collected in support of the pulley side pulper
The analysis of the signal waveform also allowed for confirmation of the diagnosis, since the impacts to identify this signal were associated with defects in the bearing outer ring (Figure 37).
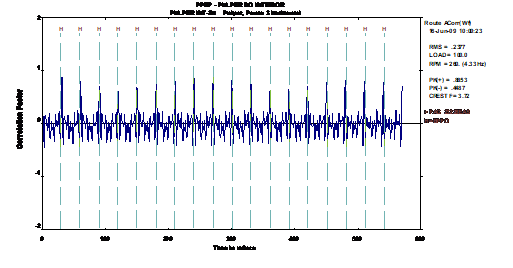
Figure 37 – Vibration analysis bearing – waveform signal which identifies impacts associated with defects in the outer ring of the bearing FAG 23228EAS
Case 7 - Recommendations made and further measurements
Given the values recorded, and the changes recorded in the frequency spectra, It was recommended the replacement of the bearings Pulper.
After replacement of the bearings, was a new measurement performed, where one finds a very significant improvement of the values obtained, made as a result of intervention (Figure 38). The frequency spectra collected after replacing the bearings, also showed a very significant improvement compared to measurement made with the bearing degraded.
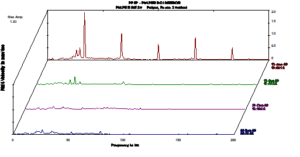
Figure 38 - Vibration Analysis bearing – Frequency spectra collected before and after the replacement of the bearings Pulper

Figure 39 - Vibration Analysis bearing – Bearing photograph after replacing revealing degradation
Case 7 – Vibration analysis bearing – Conclusion
By measuring vibration was possible to diagnose and timely planning intervention equipment, without there being an impact on the production process, avoiding overtime production losses or even catastrophic equipment failure.