Vibration analysis gears
Vibration analysis gears – frequency spectral components
When does the analysis vibrações gears, even if the frequency spectrum of the vibrations is often very complicated and seemingly, It can usually be decomposed in the combination of the following effects:
a) Frequency of gearing and Harmonics
Represent the average deviation from the ideal profile meshing tooth profile, that is, the perfect tooth profile.
b) Side bands
Components usually originated in the modulation of meshing, caused either by slow variations (by eccentricity) or sudden changes caused by occasional irregularities (bites, slots, etc.).
In addition to the modulation of engagement, the sidebands can also arise modulate a Natural Frequency. In this case indicate the shock repetition rate which excites the Natural Frequency.
c) Ghosts components
They appear to be a Frequency gearing, but with a different number of teeth that the gear has.
Generally they can be related to the number of teeth of the indexing gear cutter which carried out the machining, and are due to errors in this gear.
d) Mounting frequency
Component created a pair of gears used when it changed its relative position.
e) Teeth repetition frequency
Component created when the same pair of gear teeth.
f) Natural frequencies
Components that arise when a damaged gear begins to cause shock.
g) Rotation speed and harmonic
Vibration analysis gears – Frequency of gearing
The gearing frequency can be calculated from the product of the number of teeth by the speed of rotation..
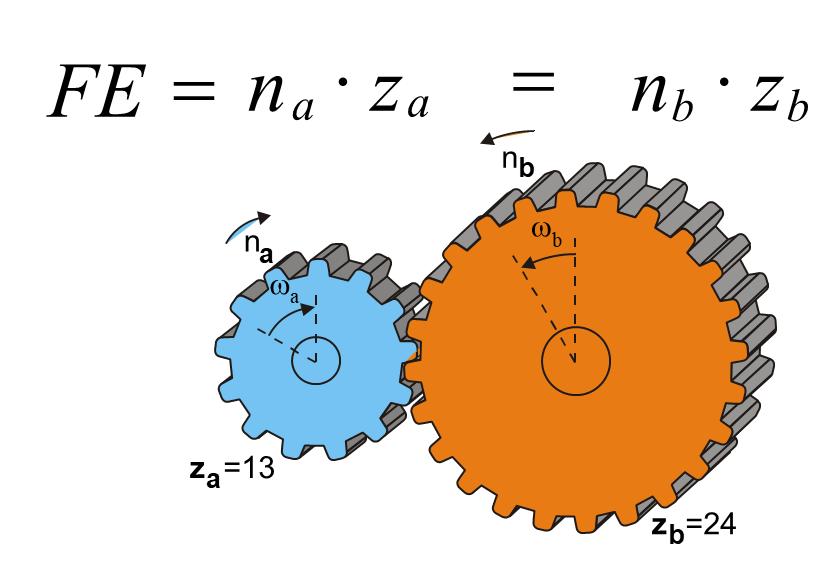
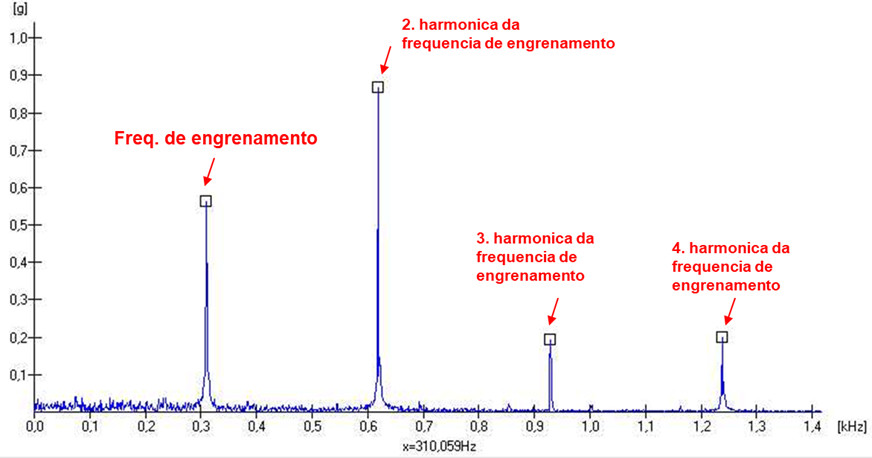
The ideal tooth profile deviation, constant every time it makes gear, is that, therefore, causes a periodic vibration frequency gearing, You can have various causes.
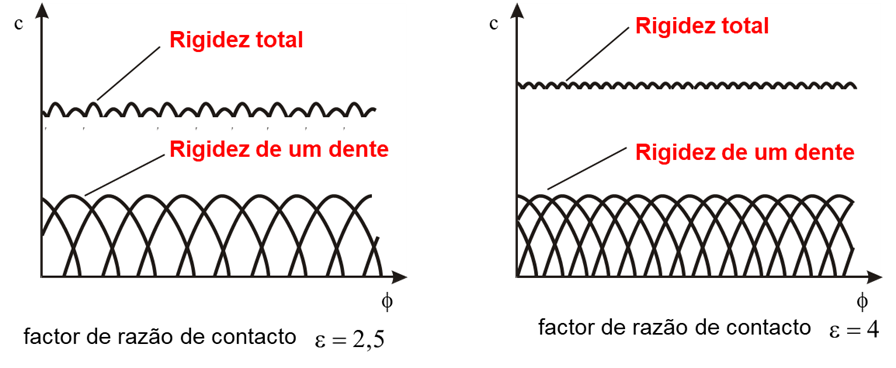
The effect of the number of teeth engaged simultaneously
On the one hand, there is a deflection of the teeth under load, which varies each time that is shared among a different number of teeth in each gear cycle. The greater the number of teeth under load at each instant, the smoother the gear operation will be and the less vibration generated., as shown in Figure.
The effect of wear
On the other hand, there are deviations resulting from uniform wear, machining and assembly faults.

Figure – Vibration analysis gears – Deflection of the teeth of a load of gear for action
Due to deformation of the teeth is essentially dependent on the load, to obtain comparable spectra, measurements have to always make the same charge. The loading must also be sufficient to ensure that the teeth are in permanent contact.
Yet, with constant load, any change in the amplitude frequency and harmonic gear should come from the wear. The figure shows a typical wear profile.
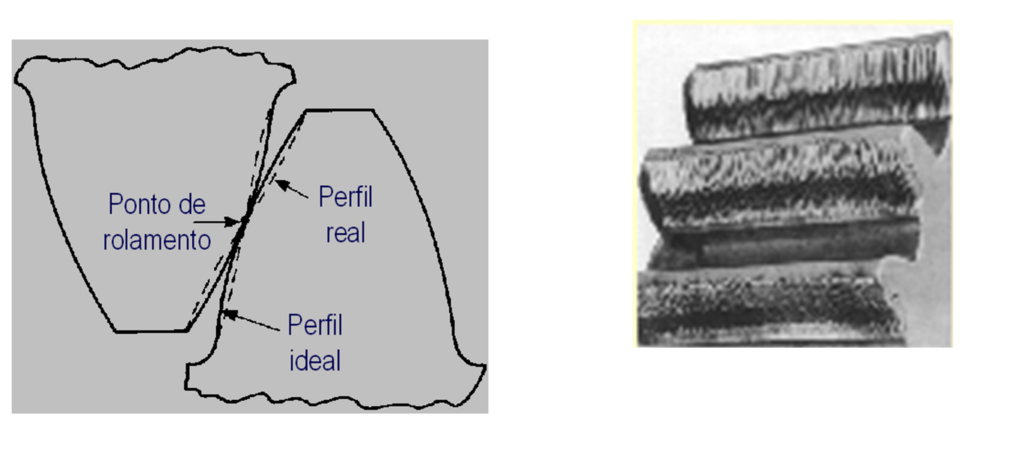
Figure – Vibration analysis gears – Typical wear profile
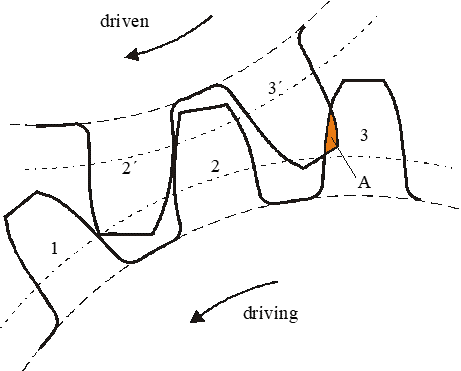
Wear is greater on both sides of the pitch circle due to slipping, while at the midpoint of the tooth pure rolling occurs. This profile error will tend to cause considerable distortion of frequency gearing, with the result that the wear of the teeth is more visible in harmonics than the fundamental. General rule, it is advisable to control at least the first three harmonics of the frequency of engagement, when you want to follow this type of defect.

Figure – Vibration analysis gears – Typical changes in harmonic frequency spectrum meshing frequency due to wear
Below you can see a video about gear failures.
Example 1 – Evolution of the frequency spectrum of a gearbox over the years
Below you can see the evolution of the frequency spectrum of a gear over the years.
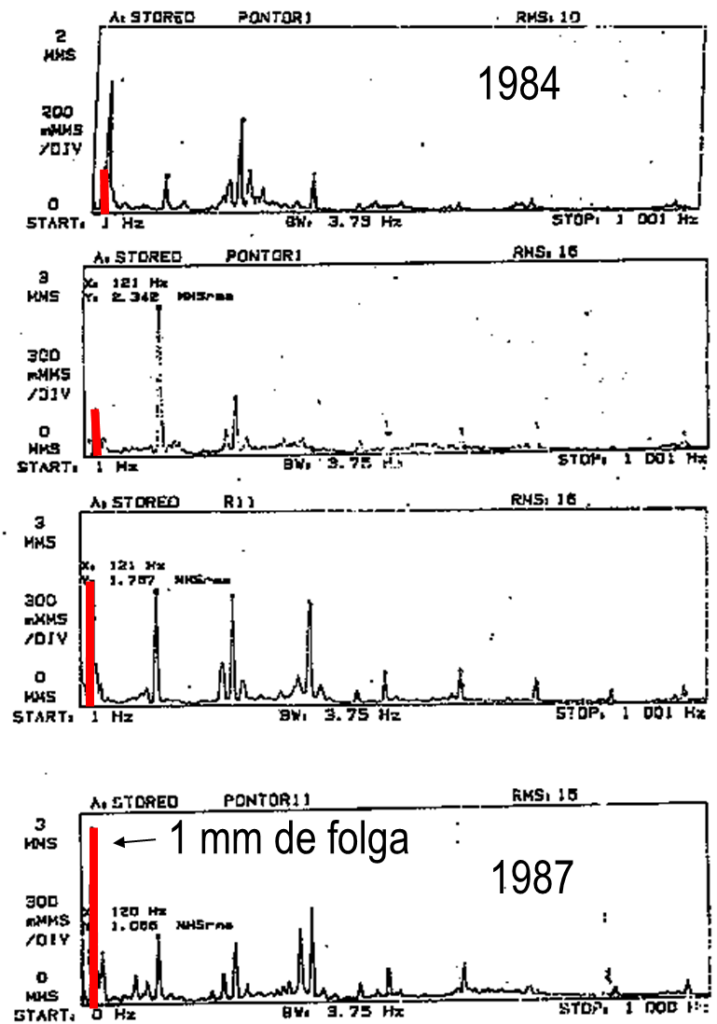
The frequency spectrum of a real gear
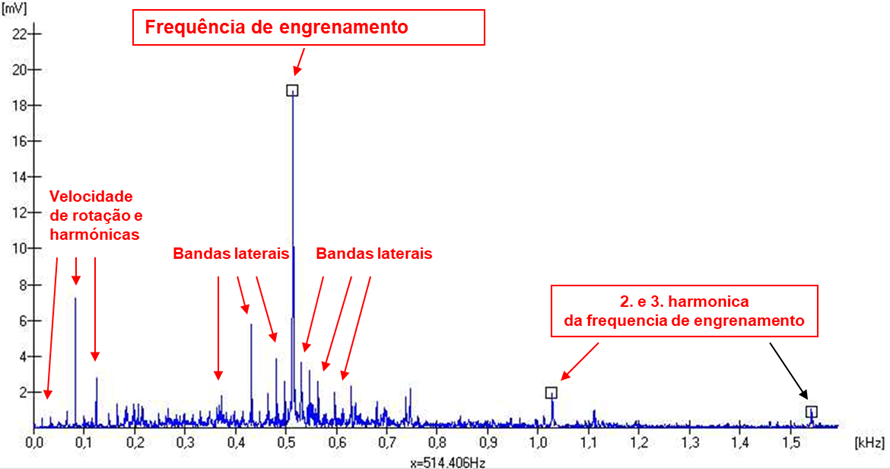
In a real gear, frequency components always appear in addition to the gearing frequency..
Misalignment of wheels
The mounting problems, normally, They give rise to high amplitude components of the frequency gearing, It is the misalignment and incorrect clearances.
The misalignment causes an eccentricity gear creating a variable gap, originating, therefore, a deviation of the position of the teeth of its ideal position.

Figure 4 – Vibration analysis gears – misaligned shaft
Another consequence of the eccentricity is the creation of a reaction between the gears, when the clearance is insufficient. so there arises a component to the speed of rotation to monitor the frequency of gearing.
Like this, any cause that provokes an eccentricity of a gear can cause the rotation speed components and high frequency range gear. As possible causes of eccentricity has a poor manufacturing or imbalance, in high-speed gears.
In spur gears, misalignment often axial vibration generator.
Example 2- Misalignment of spur gears
In the figure you can see the Global Levels of Vibrations, vibrations caused by the meshing frequency, the bearings of the drive sprockets (with Spurs), a cement kiln, misaligned crown. Note the asymmetries of levels, namely the high amplitudes in the horizontal direction in the bearings on the free side.

Incorrect clearances between gears also cause vibrations at frequency gearing.
Vibration analysis gears – Side bands
Most vibration components at different frequencies of meshing frequency can be explained by their modulations. For example, due to the dependence of the deflection of teeth, load, any fluctuation in this (for example caused by misalignments) will tend to cause a corresponding variation in amplitude, thus causing an amplitude modulation as can be seen in the figure..
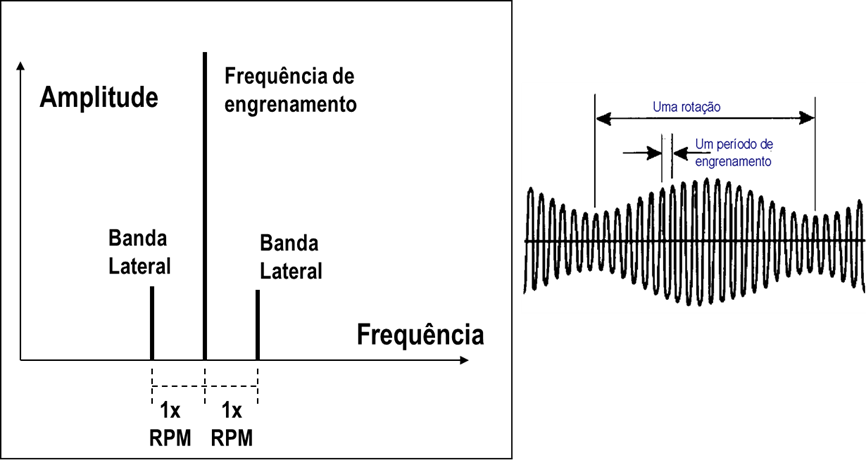
Below you can see a video about vibration modulation.
Example 3 – Modulation of rotational speed by gearing frequency due to the ovality of the crown of a cement kiln
Below you can see an example of this phenomenon in a real gear. In this case the crown of a cement kiln mill.
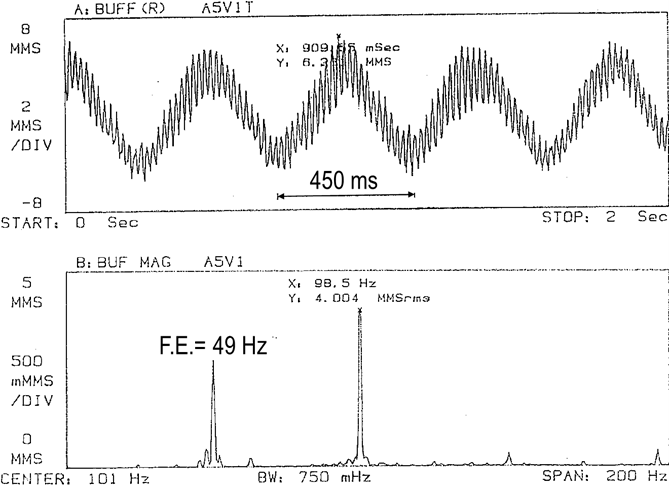
This effect existed and was caused by the normal ovality of the kiln crown due to its size.
The frequency modulation
At the same time, fluctuations in tooth load will cause variations in angular velocity., thereby causing frequency modulations.
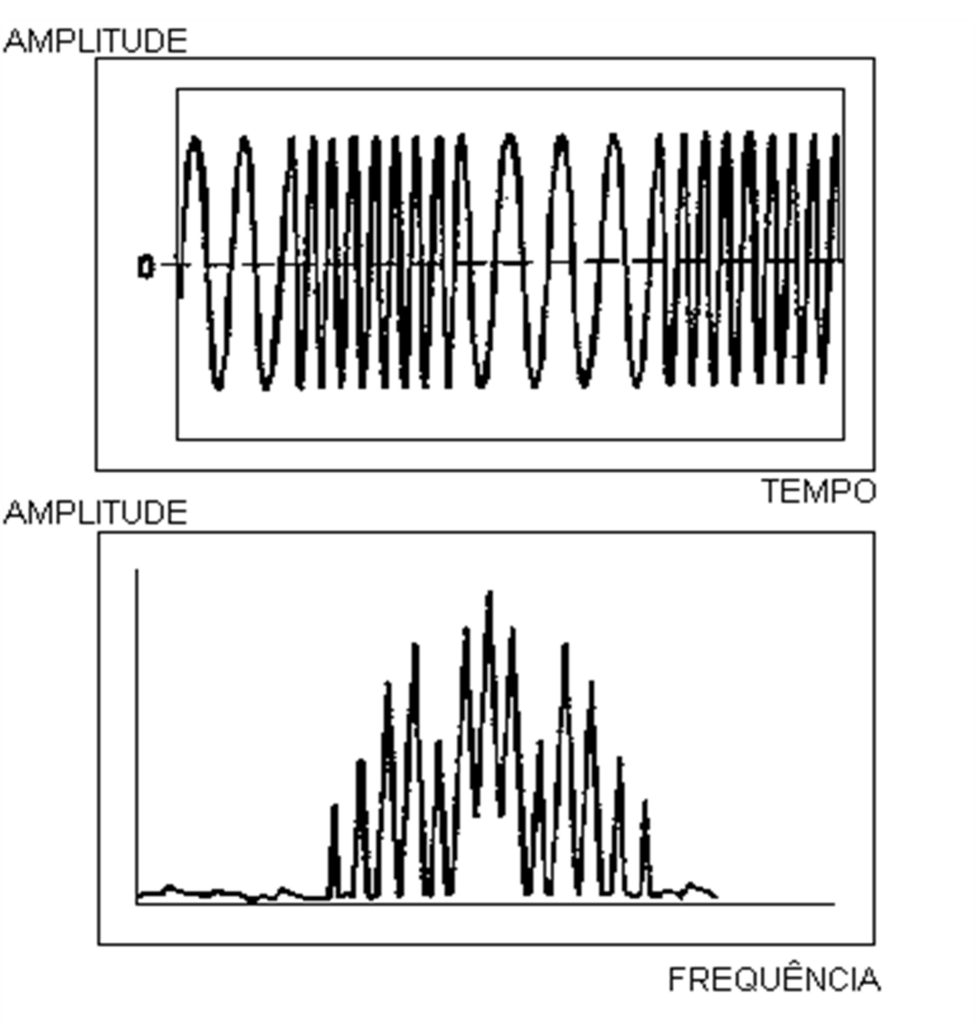
Below you can see variations in the speed of rotation of a shaft, views with a strobe. These variations constitute the frequency modeling.
The modulation amplitude and frequency causes the appearance of sidebands around the basic frequency (frequency of engagement and its harmonics), with a spacing equal to the modulating frequency (generally the speed of rotation of the gears), thus containing important information for making a diagnosis as to which of the gear that is causing.
The effects of point defects and distributed defects
The following figure shows the effect of a defect in a tooth point and an eccentricity.

A broken tooth produces a pulse on each rotation (amplitude modulation). This type of malfunction gives rise to a spectrum dominated by engagement with frequency small amplitude side bands, spaced Impulse frequency.
If there are many defects located, such as for example the case of multiple stings stocks, vibrational effects become evident then.
In the case of eccentricity, appear important sidebands around the frequency of engagement. A misalignment causes this effect. It is distinguished from bites phenomenon by cause significant vibration components at the speed of rotation of misaligned gear.
Even in gears in perfect condition, It is normal to find sidebands, they not being itself a malfunction. Its growth or the appearance of new sidebands, is that problem is evidence of evolving.
Vibration analysis gears – Ghosts components

As already mentioned, these arise from errors in the teeth of gear acionante indexing table which is mounted on the gear machining stage. The vibration frequency, later generated by gear while on duty, corresponds to the number of teeth and, therefore, It must be an integer multiple of the gear rotation speed. This provides an indication that an unknown frequency may be a ghost component, when you can not meet the manufacturer's data.
Another indication can be obtained through its behavior in function of load. Since this component represents a constant geometric error, It should not be greatly influenced by the load.
Once recognized, phantom component, usually do not cause any problems, there is a tendency for it to decrease with time (wear).
Vibration analysis gears – Mounting frequency
The teeth of a pair of gears, when in operation will create a “bed”. It turns out, unless the number of teeth of the two gears, are relatively prime, a given tooth of a gear will not contact all the other teeth. They are created so families of engagement that give rise to “Beds”. If after a disassembly of gears, these do not come back to be placed in exactly the same relative position, They give rise to a vibration whose frequency can be calculated as follows:
F=Fe/N
Mounting frequency f =
Fc = frequency gearing
Greatest Common Divisor N = the number of teeth of the two gears
Vibration analysis gears – teeth repetition frequency
If there is a defect in a pair of teeth of two gears, Each time you give the meshing of this pair will occur a boost.
This vibration occurs, therefore, the gearing repetition frequency of a pair of teeth, can be calculated as follows:
F = (Fe x N) / (Np x NC)
F – Repetition Frequency
N – Greatest common divisor of the number of teeth of the two gears
For example, – Number of pinion teeth
Nc – Number of teeth crown
Vibration analysis gears – Rotation speed and harmonic
The components of the rotation speed and its harmonics have come from the same causes as the other machines: imbalances, desalinhamentos, days off, eccentricities, etc.
In the envelope spectrum they represent shock repetition frequencies.
From what has been said underscores the importance of having a vibration analyzer with high resolution of the frequency spectrum lines.
Calculation of characteristic frequencies of vibrations in gears
If you want to know the formulas for calculating the characteristic frequencies of vibrations in gears click here
Limits of vibrations in gears
If you want to know how to evaluate vibrations in gears click here
Example 4 – Vibration analysis gears - bearing failure
An apparatus comprising a motor with variable speed and a gear box, He began to develop an uncharacteristic noise normal operation. Fearing one equipment failure, maintenance services have chosen to replace the electric motor. After changing the engine, it was found that the noise remained unchanged.
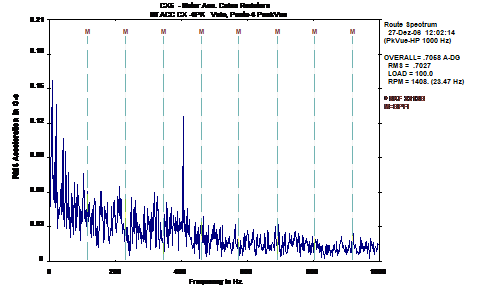
Faced with this situation, we chose to take a measurement of vibration equipment, with a view to detecting the noise source. In vibration measurement made, found that the presence of frequencies associated with degradation of the inner ring raceway bearing supporting shaft housing inlet, opposite the engine.
No spectrum PeakVue shown in the figure , the presence of frequencies can be seen from 131,46 Hz and harmonics.
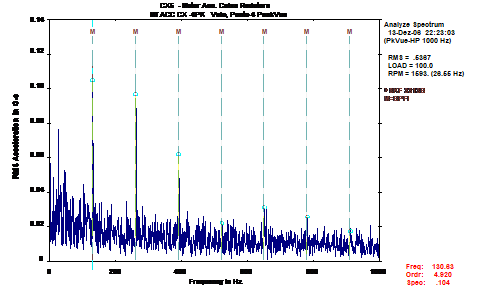
The presence of these frequencies concluded that the bearing was in degradation phase, being the noise associated with its operating status.
Depending on the collected data and the analysis performed, It was recommended the replacement of the bearings supporting the shaft housing inlet.
After replacing, It performed a new vibration measurement equipment, being shown in the figure , The spectrum collected PeakVue.
In then performed analysis, associated frequencies were not identified the development of anomalies in the bearings and the noise disappeared completely.
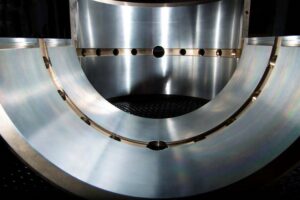
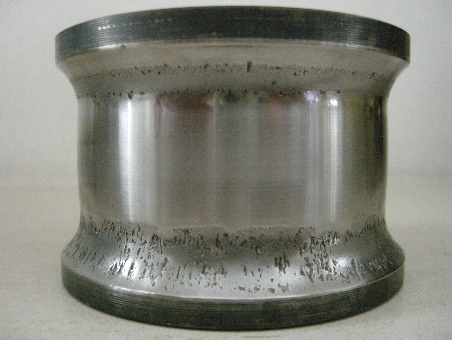
Subsequently, in order to confirm the diagnosis, It was asked to dismantle the degraded bearing. Analyzing the respective bearing components, found that the degradation of the inner ring raceway, as can be seen from the photograph shown in figure .
Example 5 – Vibration Analysis gears -folgas
Routine measurement performed to drive a conveyor belt, constituted by a gearmotor whose electric motor that runs 1492 rpm, whose output shaft rotates 60 rpm, found, vibrométrica during inspection, vibration levels exceeding the limits established based on ISO 10816.

The highest global level value was 6,7 mm/s RMS, registered in the motor support opposite the drive. Despite the higher levels vibrométricos have been registered in the motor support, opposite the drive, the collection of spectra with smaller frequency ranges (up until 50 Hz) identified the presence of the operating frequency of the reducer output shaft (1 Hz) and harmonic.
The presence of these frequencies is symptomatic of excessive clearances.
The frequency spectrum shown in the figure reveals what was mentioned earlier.
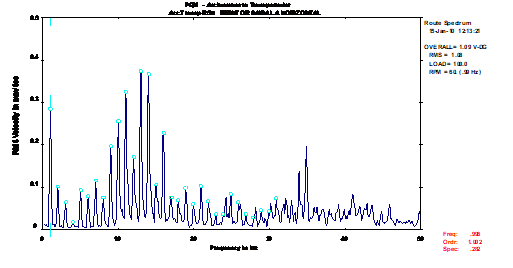
Despite vibrométricos levels have higher amplitudes in the engine mounts, given the spectra obtained, It was made the recommendation to the intervention of the reducer, namely, for checking the gaps between the "sleeve" to the output shaft and the shaft of the conveyor belt drive drum. In the performed inspection found it was indeed, the presence of clearances between said components.
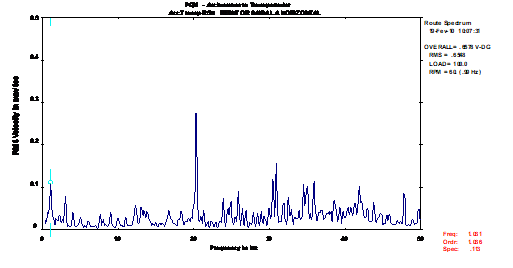
After the intervention for the anomaly correction, a new measurement was carried out where it was possible to verify a very significant improvement in the characteristic of the spectra obtained figure .
In vibrométrica inspection performed after the maintenance work on equipment, found a generalized decrease in the levels vibrométricos that the equipment is subjected. Particularly in engine mounts (points where the highest amplitude registavam), it was possible to observe a significant reduction in amplitude vibrométricas, as can be seen in the Trend graph shown in figure.
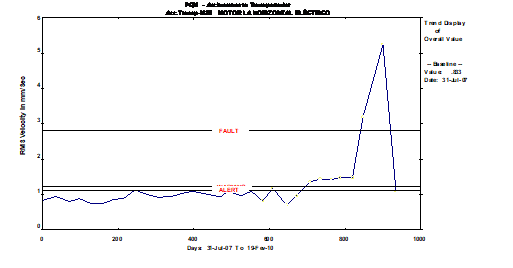
Also note that, with the intervention made, observes the disappearance of the harmonic amplitude peaks of the operating frequency of the reducer output shaft, as can be seen from the frequency spectra shown in figure.
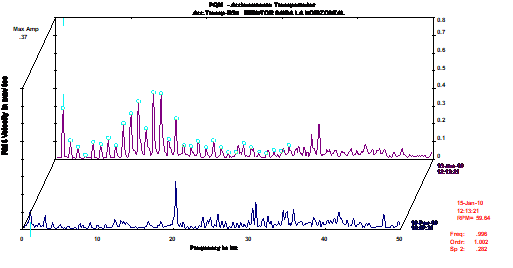
Like this, select the appropriate frequency range for the type of equipment, as well as the correct number of lines for the spectral resolution, (among other factors), It allows you to diagnose faults successfully, even in cases where low speeds make the less obvious diagnosis. Therefore, during the parameterization of the equipment in Database, should be especially careful in measuring points of settings, in order to timely detecting possible malfunctions.
Example 6 – Vibration analysis gears – cardan
A drive unit of a cylinder "Yankee", comprising a gear unit driven by two (2) motors as illustrated in Figure 16, Predictive Maintenance is included in the program defined by the customer, It is subject to regular inspections vibrométricas.
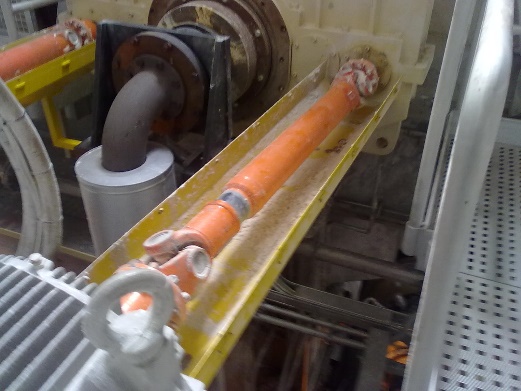
Figure - Analysis of vibrations in gears – drive unit photography
Inspection carried out in June, there was a significant increase in levels of vibrométricos presence in reducing, as can be seen in the trend graph shown in figure.
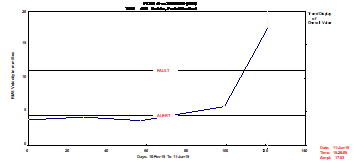
Figure - Analysis of vibrations in gears – Global Level Trend Graph Vibration registered in support of the gear unit input shafts
The frequency analysis of the recorded spectra revealed that in the presence vibrométricos in reducing levels were, about everything, influenced by the amplitude of the second harmonic of the operating frequency of input shaft, as seen below .
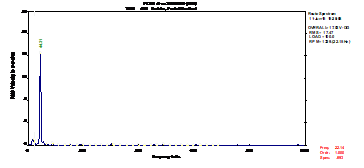
From this analysis, Also the fact that the protruding extent of operating frequency of the shaft gear unit input display greatly reduced amplitudes. For this facto, It was discarded as a cause misalignment first and foremost to the high levels recorded vibrométricos. That way, was recommended to the customer replacement / repair of unions "gimbal".
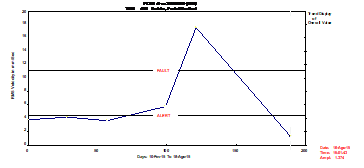
After replacement of joints "cardan", carried out by the technical services customer, during one of the scheduled installation stops, vibrométrica performed the inspection revealed a very significant reduction of the vibration levels is found that reducing subjected, as can be seen in the trend chart shown in Figure 19.
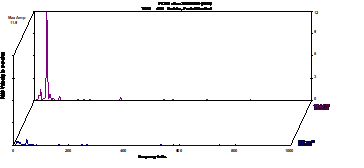
The decrease in severity originated vibrométrica, mainly, by decreasing the second harmonic of the operating frequency of the input shafts of the reducer, as can be seen in figure .
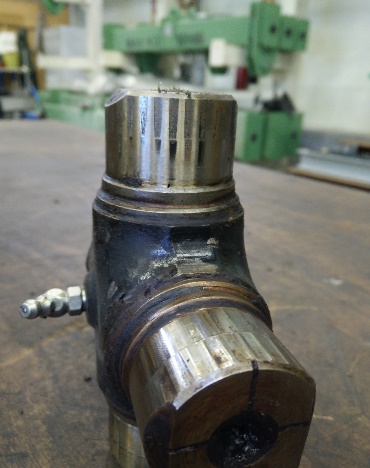
The inspection revealed the replaced components of accentuated degradation of the bearings and hangers, as can be seen in figure.
A iMPLEMENTING a Predictive Maintenance Program, based on the measurement and analysis of vibration, It allowed on time and without production losses, make it possible to intervene in the equipment minimizing intervention costs.
Example 7 – Broken tooth in reactor reducer
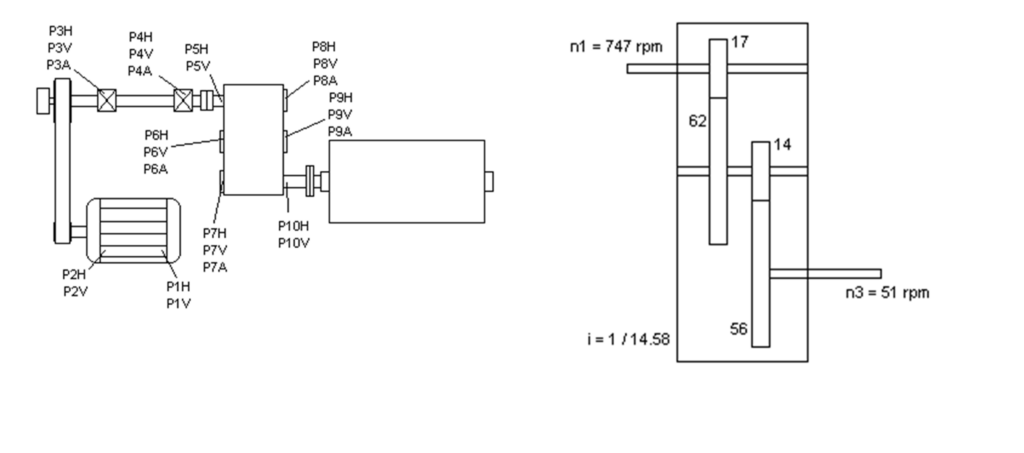
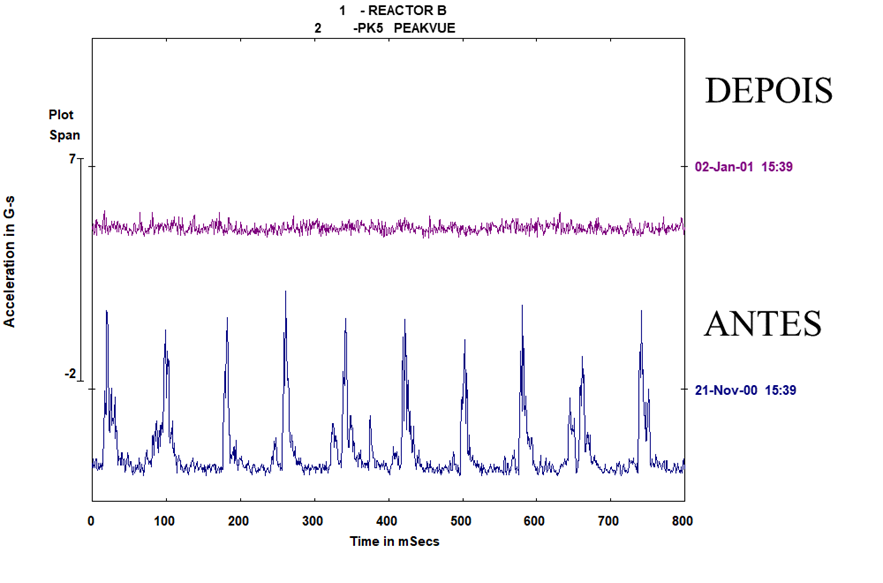
This Example took place in a reduction box of a chemical plant reactor., as shown in Figure.
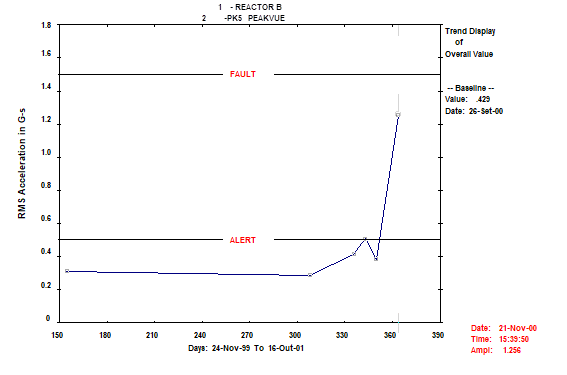
On this machine, an abnormal evolution of the level of acceleration was noticed..
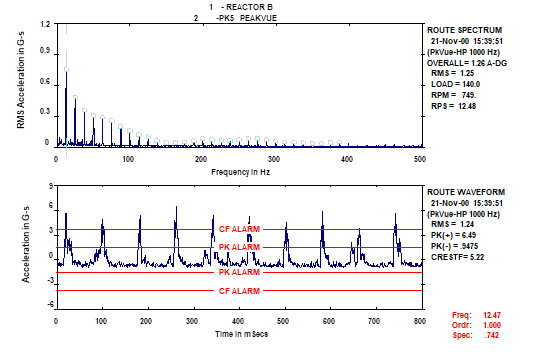
In the spectrum of the envelope and in the respective wave in time, symptoms of impacts appeared.
It was recommended to open the box and inspect it:
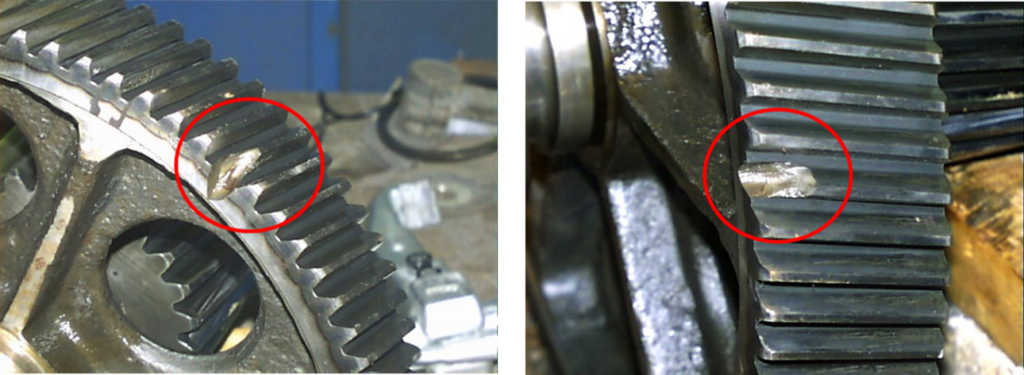
- Gears were worn.
- There were broken teeth on the input shaft gear..
- Sudden equipment failure was avoided
Below you can see the evolution of the spectra before and after repair.
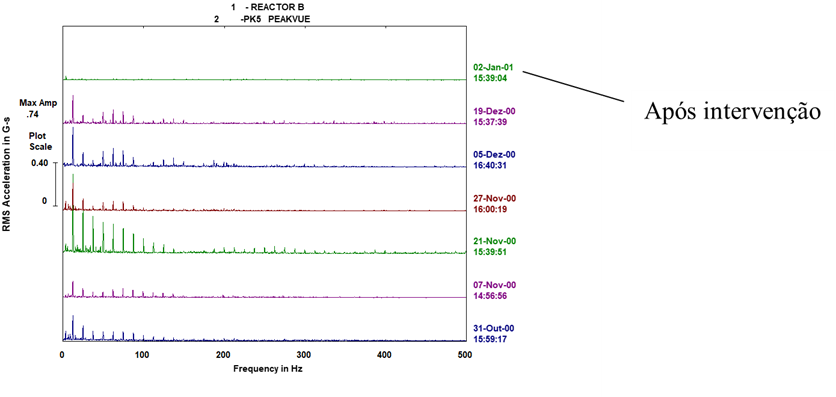
Below you can see the evolution of the time wave.
Example 8 – Broken tooth in cement kiln drive reducer
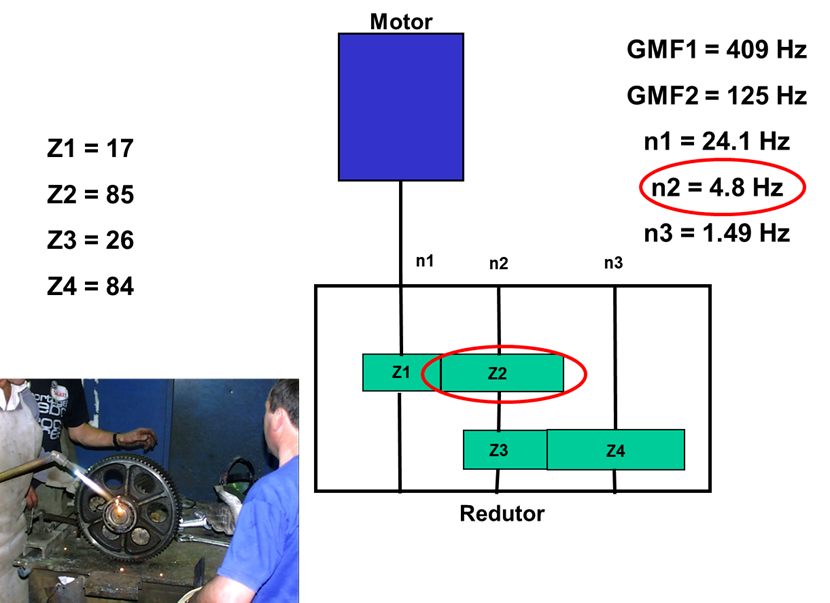
It was a reducer with two reduction stages and only the rotational speed of the input and output shafts was known.. They did not know the number of teeth on the different gears in the reducer or the rotation speed of an intermediate shaft.. What was obvious was that there was abnormal vibratory behavior.
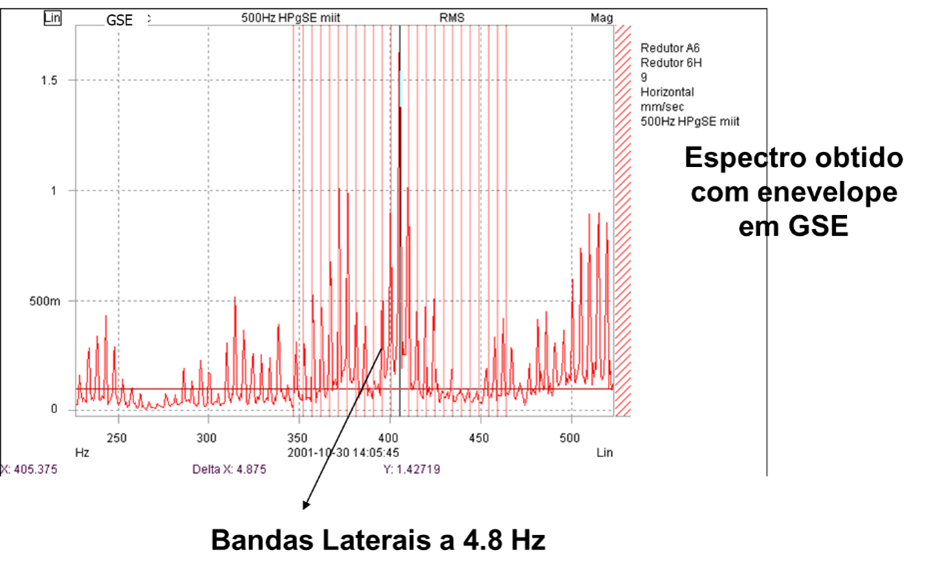
The time wave showed impacts produced by the defect in the reducer.
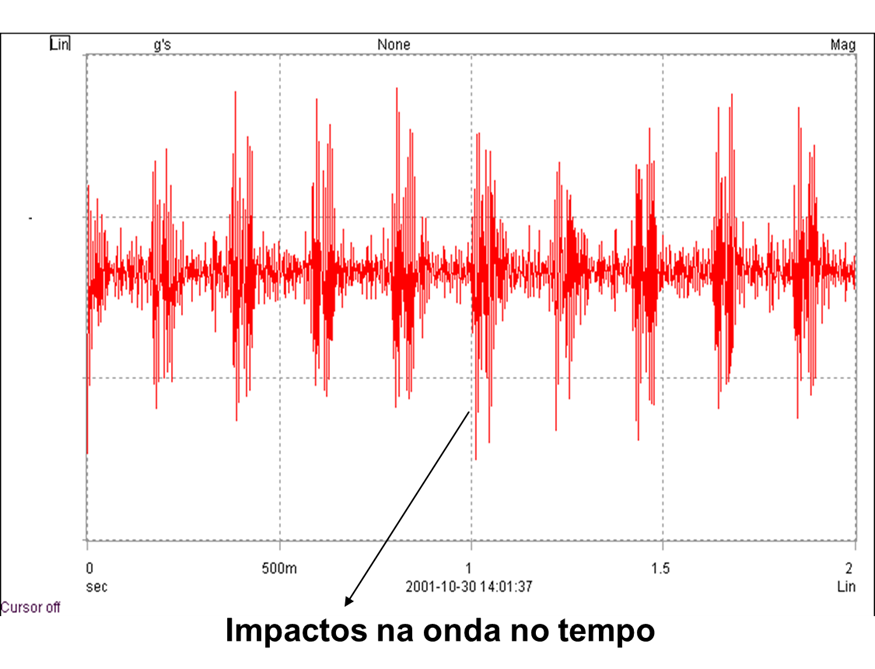
Below you can see a zoom of this wave.
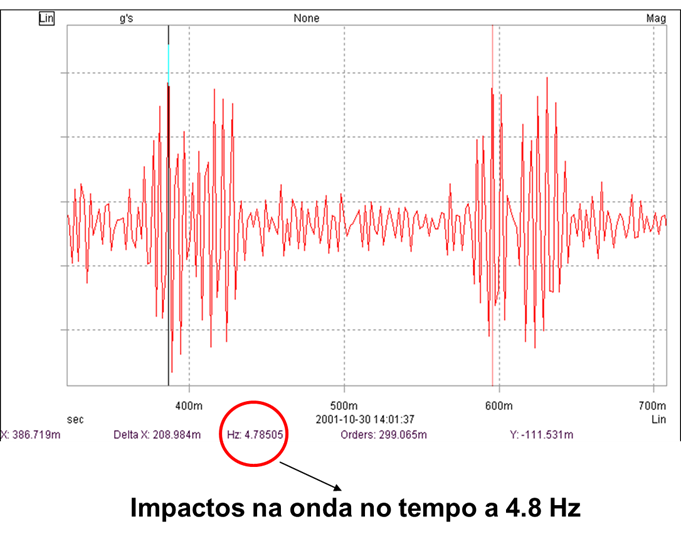
Figure - Time wave showing impacts to 4,8 Hz, which was suspected to be the speed of rotation of the intermediate shaft
With the identification of the number of teeth of each gear, it was determined that the intermediate shaft rotated at 4,8 Hz.
Example 9 – Dropped shaft in dynamic separator reducer
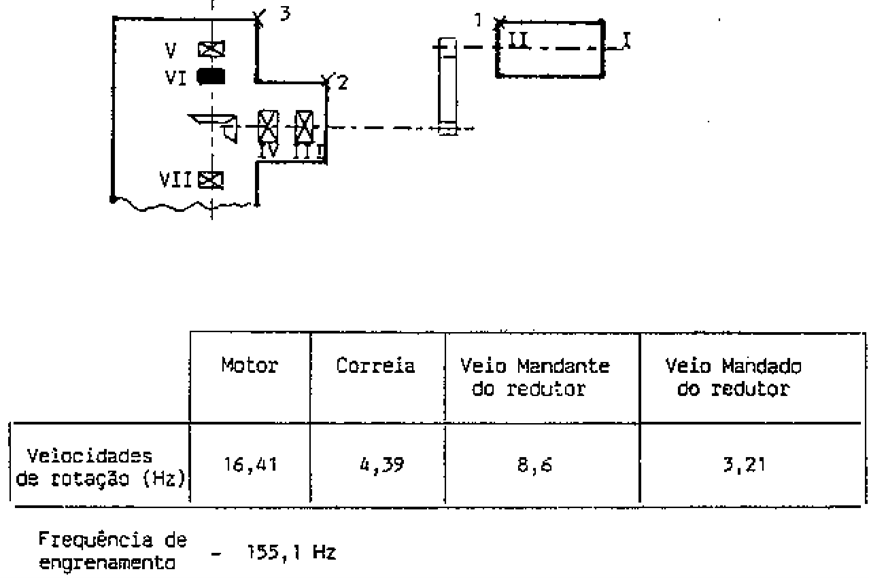
In this case the machine was a dynamic separator in a cement factory. Its characteristics were as shown below..
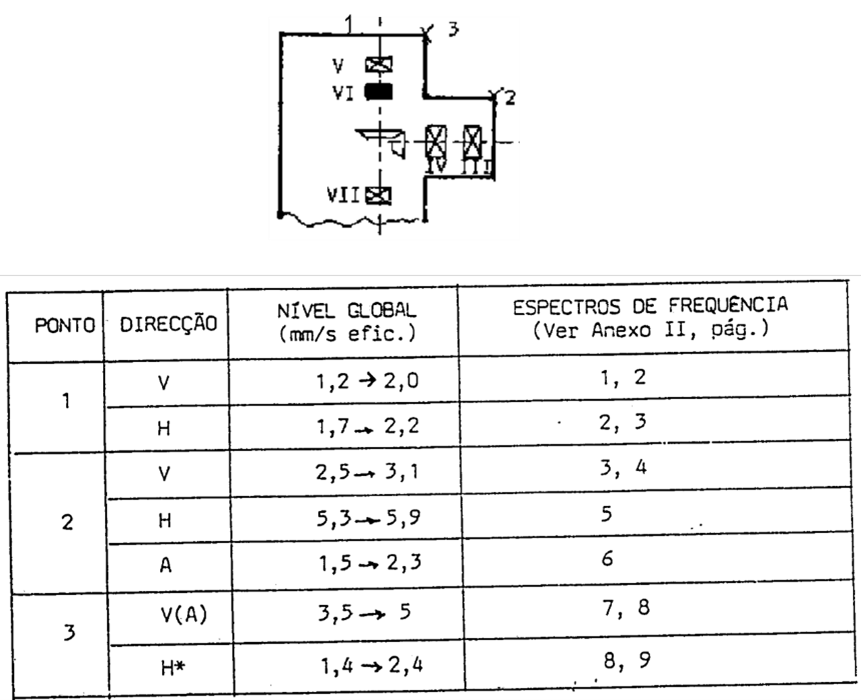
The global levels of measured vibrations can be seen below.
The measured spectrum was what can be seen below.
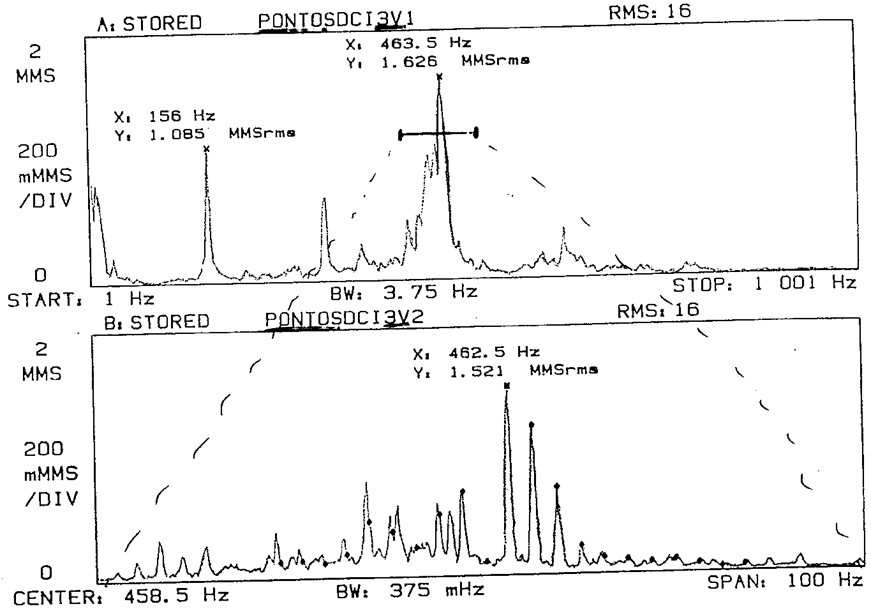
to component to 1 x RPM, horizontally had a high value.
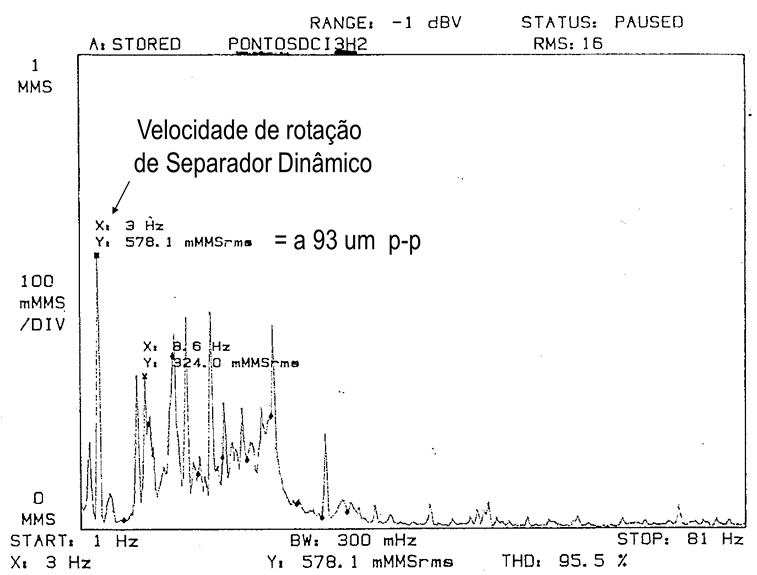
A gearbox inspection has been requested.
The vertical tapered bearing, that supported and positioned the rotor of the dynamic separator, it was down and generated poor gearing due to incorrect positioning of the gears.
Example 10 – Reducer gear degradation due to lubrication problem
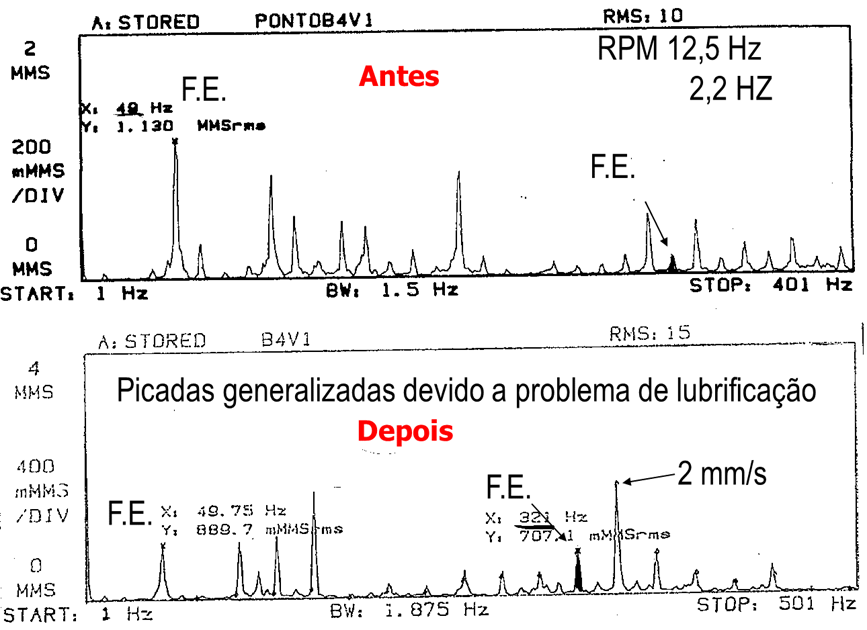
These two spectra, measured in a reducer of a mill and cement, before and after he suffered a lack of lubrication problem. This problem caused the teeth to get a lot of bites..
Note the growth of the sidebands around the gearing frequency after the lubrication problem has occurred..
Example 11 – Turbogenerator reduction gear mounted with insufficient clearance
The spectrum shown below was measured on a gearbox of a turbogenerator mounted with insufficient backlash between the gears.
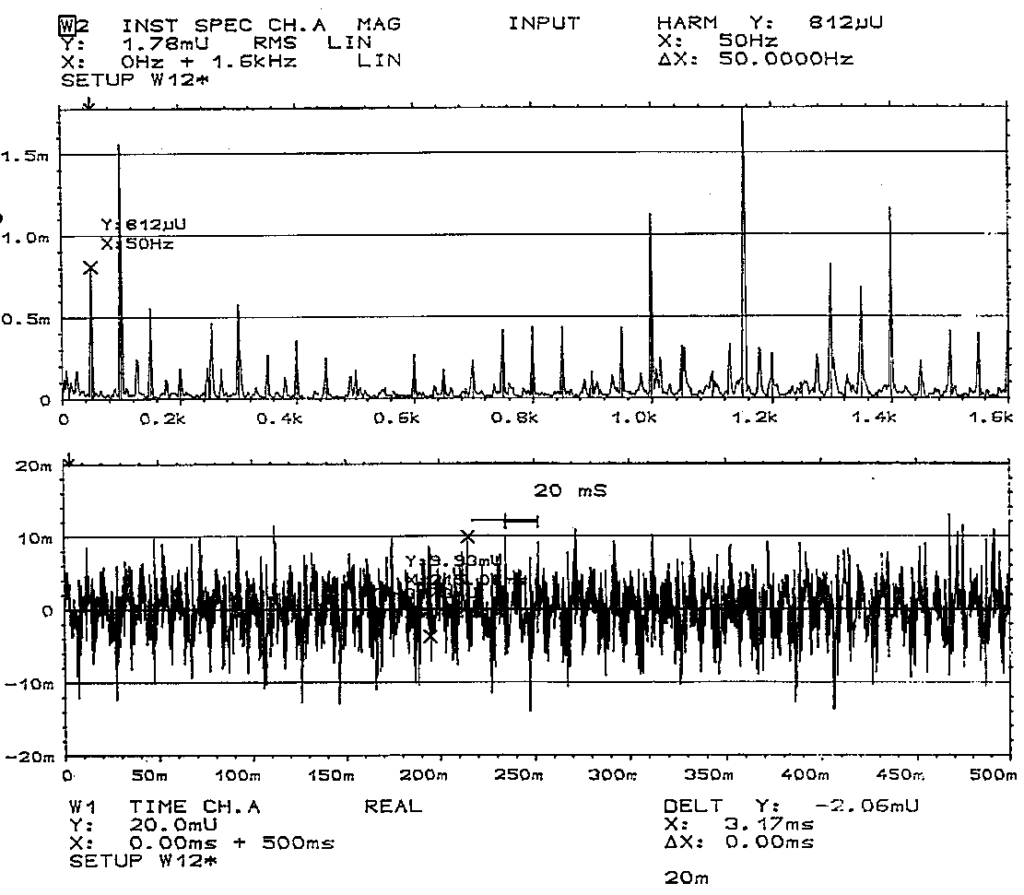
In the spectrum one could identify numerous harmonics of the rotational speed and in the time wave one could see the impulses resulting from the shocks.
This insufficient backlash led to interference between the gears.; In other words, the teeth when they came out of gear knocked.
