Analysis of vibrations in frequency bands
1 – ANALYSIS OF VIBRATION AND FREQUENCY BANDS – INTRODUCTION
This article describes how in Vibration Analysis frequency bands take on importance.
Recognizing the limitations of Global Vibration Level Measurement (Well. effective 10-1000 Hz) in the detection of some specific types of faults led to the attempt to use the Frequency Spectrum provided by the Vibration analyzers, to this end. In this context, this technique has been used for years, often involving a heavy bureaucratic burden.. Thus came the need for its automation.
Nowadays, with the dissemination of data collectors, the Automatic Comparison of Frequency Spectrums was greatly facilitated, thus having a very wide use in the measuring vibrations.
Here, the different ways to implement this technique are presented.. The following modalities will be specifically mentioned.:
- Comparison with a fixed level
- Comparison with the envelope of an FFT spectrum
- The Analysis by Bands
- The Comparison of Constant Band Percentage Spectra (PBC)
2 – COMPARISON WITH A FIXED LEVEL
The simplest way to set a Frequency Spectrum (EF) generating alarms involves setting a fixed level that, when exceeded, generates an alarm as shown in Figure 1.
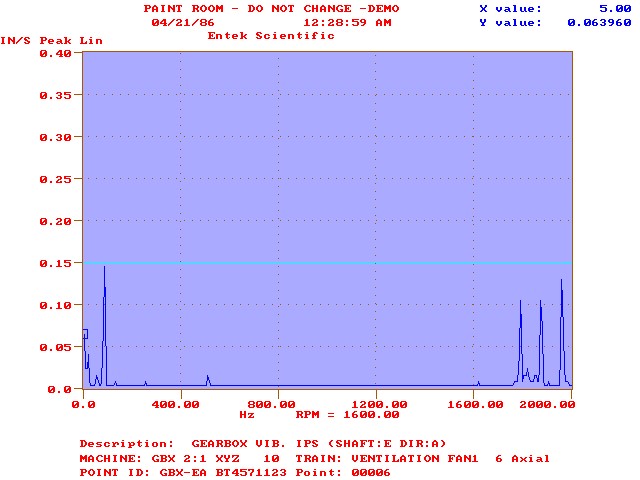
This way of implementing automatic spectra comparison has obvious limitations. The E.F component. with greater breadth imposes the level of comparison. This implies that in case of a breakdown, only under some particular conditions will peaks with smaller amplitude grow enough to generate an alarm.
This way of implementing the spectra comparison does not have obvious advantages in relation to the measurement of the Global Vibration Level, unless the spectrum is approximately flat, which is very rare. just the(s) larger(is) components(s) of the spectrum has any chance of triggering an alarm, which in any case is readily obtained with the measurement of the Global Vibration Level.
3 – COMPARISON WITH THE PROFILE OF AN FFT SPECTRUM
An intuitive way to do automatic FFT spectra comparison, on computer, consists of generating an envelope of a measured spectrum, as you can see in Fig.2.
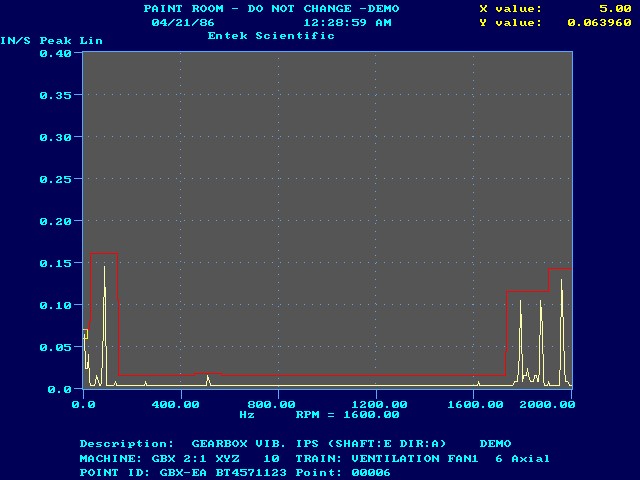
there is no doubt that, this approach can offer satisfactory results., in the automatic detection of abnormal evolution of visible components of a frequency spectrum (on linear vertical scales). However, its implementation has two features that reduce its sensitivity.
The first is related to the fact that, even so-called constant speed machines have, mostly, slightly variable speed. In fact, in asynchronous electric motors, the speed variation between load and no load conditions can reach 40 RPM. Right at the first harmonic of the rotation speed the envelope profile must be “extended”, no minimum of 40 RPM for each side so as not to run the risk of generating false alarms. At the frequency equal to the hundredth harmonic of the rotation speed, the profile should be “extended” 100X40=4000 RPM and so on. Thus and as shown in Fig.. 2, in the area of the spectrum corresponding to the highest frequencies, the alert profile will be much wider than the components that give rise to it. Of course this will reduce the sensitivity of the technique..
Case, for example, a component of the spectrum, of relatively small amplitude and situated close to another larger, starts to grow due to a deterioration of the working condition of a machine organ, there is a risk, significant, this fact will not be automatically detected and thus an unexpected failure.
If you are looking at a variable speed machine, or problem worsens.
Thus arises the need to implement a speed compensation.
The second feature is that a linear vertical scale is used in this type of comparison.. When you implement the EF comparison you are, from something, so as to assume that the frequency spectrum components, small amplitude, are also important for controlling the condition of a machine.; however the way the alert profile is generated will prevent the smaller components, that on a linear vertical scale are lost in the “weapon”, will ever generate an alarm for having exceeded the boundary of the envelope.
All damage that manifests itself in the form of the growth of components in the turf, will hardly be detected by comparing FFT spectra on vertical linear scales. In this case, there are some malfunctions in bearings and gears rotating at low rotation speed.
In order to observe the larger and smaller components simultaneously, vertical logarithmic scales must be used.. Thus arises the need for its use.
4 – ANALYSIS OF VIBRATION AND FREQUENCY BANDS – CONTROL BY BANDS
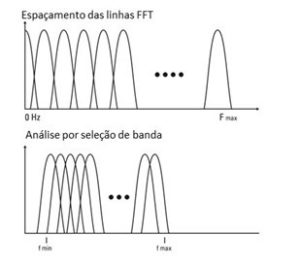
A variant of this type of FFT spectra comparison is called band control (Fig.3)
In this mode, a maximum level is defined for a given spectrum band. Alarms can be generated in two alternative ways:
- if any component reaches this level, an alarm is generated.
- if the energy in the band reaches this level, an alarm is generated
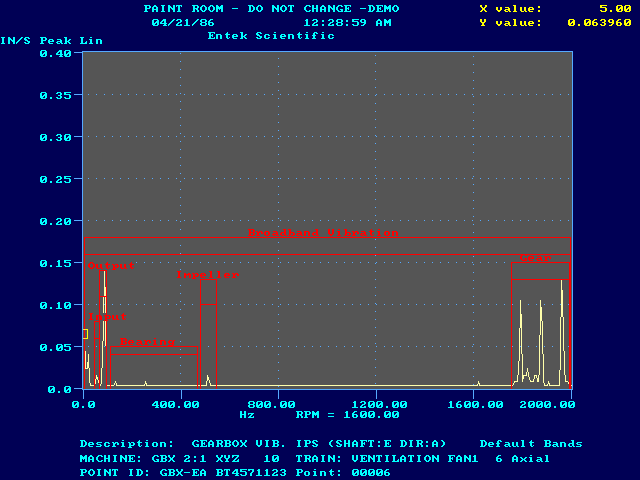
Nowadays this last technique is the most used by, with experience, has proved to be the simplest to implement with satisfactory results.
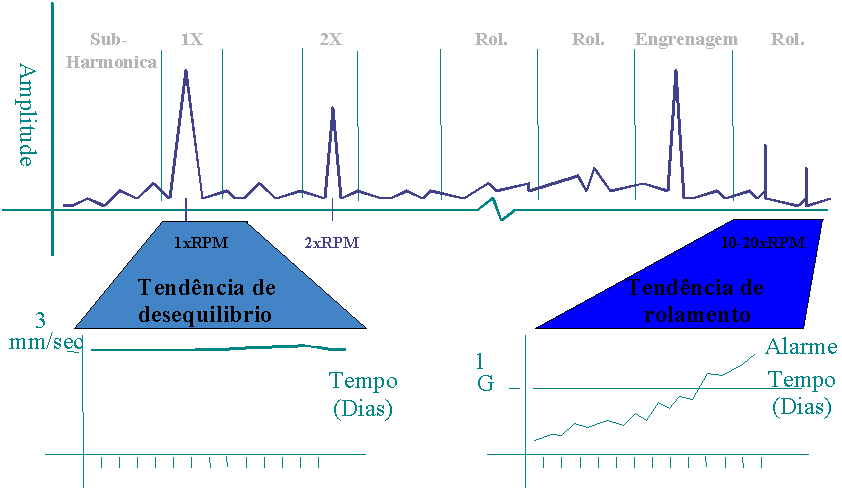
With this technique it is easily possible to separate the vibration of an imbalance from the vibration generated by a bearing failure.
5 – COMPARISON OF CONSTANT BAND PERCENTAGE SPECTRA (PBC)
One way to carry out the control by bands is to group the entire spectrum into frequency bands, third of octave. This grouping is done through the use of Percentage Spectra of Constant Band (Figure 4). In this type of spectrum, the amplitude of each band represents the sum of the amplitude of all vibratory components that fall on it (and not the biggest component in this band). Like this, if a small amplitude component starts to grow, this will immediately be reflected in the amplitude of the respective frequency band., what, therefore, will also grow, giving rise to the triggering of an alarm.
The width of each band is equal to a fixed percentage of its center frequency..
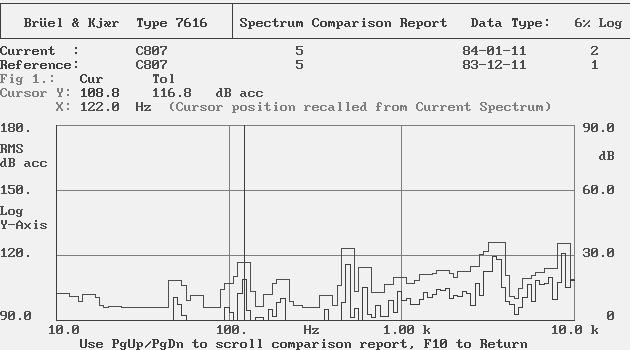
This technique is very sensitive to false alarms due to the way in which the sensor is mounted and nowadays it is little used.
6 – ANALYSIS OF VIBRATION AND FREQUENCY BANDS – CONCLUSION
The use of the FFT Frequency Spectrum in Fault Diagnosis presents important advantages that lead to its widespread use for this purpose. When it comes to troubleshooting, the most used technique nowadays is band control, in the mode of measuring the energy in the band.

