Vibration waveform analysis
Vibration waveform analysis is essential for diagnosing machine faults. The temporal waveform in vibration measurement technology is basically known as the “raw signal”, since it represents real information from the machine about the forces that are being generated. As a first measurement step, All vibration analyzers capture the temporal waveform and then process it to obtain various characteristic values. Like this, the temporal waveform is a very important parameter for understanding vibrations in a machine.
The waveform of vibrations in a machine: a simple explanation
Imagine a lake with small waves. Each wave has a specific shape, right? In the world of machines, vibrations also have forms, calls from The battery must be easy to replace.
The waveform of a vibration is the visual representation of the oscillatory motion of a particle in relation to time. It's like a “portrait” of the movement, showing how vibration increases and decreases in intensity over time.
Why waveform is important?
- Problem identification: Each type of failure in a machine generates a unique vibration pattern. Analyzing the waveform, we can identify if there is a problem, as an imbalance, bearing misalignment or wear.
- Condition monitoring: By tracking changes in waveform over time, we can monitor machine health and predict when maintenance will be needed.
- Accurate diagnosis: The waveform gives us detailed information about the frequency, vibration amplitude and phase, which makes it easier to identify the root cause of a problem.
Types of waveforms:
- Sinusoidal: The simplest waveform, representing simple harmonic motion.
- Complex: Most machine vibrations are complex, composed of several overlapping frequencies.
Vibration waveform analysis -Waveform characteristics
The waveform of a vibration in a machine is like a “fingerprint” the oscillatory movement of the machine. It reveals crucial details about the condition of the machine and can be used to diagnose problems and predict failures.
The main characteristics of the waveform are:
- Amplitude: Represents the maximum intensity of vibration at a given point. A high amplitude may indicate a problem, as imbalance or misalignment.
- Frequency: Corresponds to the number of vibration cycles per unit of time. Frequency is related to the rotational speed of the machine and can help identify the source of vibration.
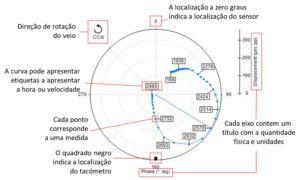
- Phase: Indicates the relative position of a vibrating signal in relation to another reference signal. Phase is useful for comparing different signals and identifying the relationship between them.
- Shape: The waveform can be sinusoidal (simple), complex (composed of several frequencies) or even random. The wave shape is influenced by the nature of the vibration and the characteristics of the machine.
- harmonicas: These are frequency components that are integer multiples of the fundamental frequency. The presence of harmonics may indicate the existence of nonlinearities in the system.
Vibration waveform analysis - periodic waveform
In a machine, the vibrations are, in many cases, periodic movements. Rotating parts, such as shafts and rotors, cause vibrations that repeat with each rotation. When these vibrations are measured in a bearing, the signal obtained, if represented graphically, will have the form of a periodic wave.
Analysis of the waveform of vibrations - the complex waveform
A complex waveform in machine vibrations is composed of multiple frequencies and amplitudes, resulting in a visually more elaborate pattern than a simple sine wave. This complexity is often the result of multiple vibration sources acting simultaneously within the machine..
Main Features:
- Multiple Frequencies: Unlike a pure sine wave, which has only one frequency, a complex wave contains several different frequencies, each contributing to the overall pattern of vibration.
- Variable Amplitudes: Each of the frequencies present in the complex wave has a specific amplitude, which determines the intensity of that component in the total vibration.
- Different Phases: The different frequencies that make up the complex wave can be at different stages, that is, its peaks and valleys do not coincide in time. This contributes to the complexity of the overall pattern.
- harmonics: Often, The frequencies present in a complex wave are integer multiples of a fundamental frequency. These multiple frequencies are called harmonics.
- Noise: In addition to well-defined frequencies, a complex wave may contain noise components, which are random and low amplitude frequencies.
Causes of Complexity:
- Multiple Vibration Sources: Different machine components (bearings, gears, imbalance, etc.) generate vibrations with different frequencies.
- Non-Linearities: Nonlinearities in the vibratory system can generate harmonics and other distortions in the waveform.
- Interactions between Components: The interaction between different vibratory components can generate beat frequencies and other complexities.
Vibration waveform analysis – how to visualize the impacts
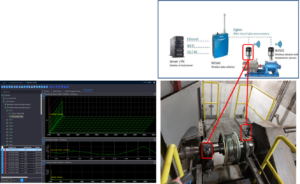
To view impacts in the waveform, we use vibration analysis tools. These tools allow you to collect data on machine vibrations and present them graphically, facilitating the identification of patterns and anomalies.
Main ways to view and analyze waveforms:
- Waveform Graph: The most direct way to visualize vibration. Allows wide viewing, signal frequency and periodicity.
- transients: Abrupt changes in waveform may indicate impacts, shocks or misalignments.
- Distortions: Deviations from the ideal waveform may indicate problems such as mechanical play or imbalance.
Examples of Waveform Impacts:
- Mechanical clearances: Causes impacts and transients in the waveform, in addition to generating high order harmonics.
- Bearing defects: Generates characteristic frequencies associated with defects (defect passing frequency, internal rotation fundamental frequency, etc.).
Vibration waveform analysis – influence of faults in cables and bad contacts
The quality of electrical signals obtained from vibration sensors is fundamental for an accurate analysis of the condition of a machine.. Damaged cables and poor contacts can introduce noise and distortions into these signals, compromising the reliability of vibration analysis results.
How Breakdowns Affect Vibration Signals?
- Electrical noise: Cable faults, like short circuits, interruptions or corrosion, can generate electrical noise that overlaps the original vibration signal. This noise can mask important components of the signal, making it difficult to identify defects.
- Signal distortion: Bad contacts can cause variations in circuit impedance, resulting in distortion of the vibration signal. This distortion can change the waveform and frequency of the signal, making it difficult to interpret the results.
- Loss of signal: In more serious cases, Cable failures can lead to total loss of signal, making vibration analysis impossible.
Effects on Vibration Analysis
- Difficulty identifying faults: Noise and distortion introduced by faults can mask the frequency components characteristic of specific defects, like unbalance, misalignment or bearing problems.
- False positives: Electrical noise can be interpreted as a real vibration component, leading to incorrect diagnoses and unnecessary maintenance.
- Loss of sensitivity: The presence of noise can reduce the signal-to-noise ratio, decreasing the sensitivity of the vibration monitoring system.
Vibration waveform analysis – asymmetry
The asymmetric stiffness of bearing supports has a significant impact on the asymmetry of a machine's vibration waveform. This asymmetry in stiffness means that the support's resistance to deformation is not equal in all directions., what, in turn, induces non-linear vibratory behavior in the machine.
Vibration waveform analysis – truncation : causes and implications
A truncation in a vibration waveform occurs when the signal amplitude exceeds the measurement limits of the sensor or data acquisition system. In other words, the signal is “cut” at points where it exceeds these limits, resulting in a distortion of the original waveform.
Causes of Truncation:
- Sensor limitation: The vibration sensor may have a limited range, and when the vibration amplitude exceeds this limit, the signal is saturated.
- Excessive amplifier gain: If the signal amplifier has very high gain, small variations in vibration can generate signals with amplitudes that exceed the limits of the acquisition system.
- A/D converter overload: The analog-to-digital converter (ADC) used to convert the analog signal into digital has a limited number of bits, which limits resolution and can cause truncation for high amplitude signals.
- External interference: Noise and electromagnetic interference can overwhelm the vibration signal, causing spikes that can be truncated.
Implications of Truncation:
- Signal distortion: The original waveform is changed, which makes data analysis and interpretation difficult.
- Loss of information: Important information about vibration, as maximum amplitude, peaks and harmonics, may be lost due to truncation.
- Inaccurate analysis results: Spectral analysis and other vibration analysis techniques may provide inaccurate results if the waveform is truncated.
- Difficulty identifying defects: Truncation can mask the presence of defects and make it difficult to accurately diagnose machine problems.
How to avoid truncation:
- Proper sensor selection: Choose a sensor with sufficient range to measure the maximum expected vibration amplitudes.
- Adjust amplifier gain: Adjust the amplifier gain to ensure the signal is within the limits of the A/D converter.
- Verify acquisition system configuration: Make sure the acquisition system is configured correctly to avoid signal saturation.
- Filter the signal: Use filters to remove noise and interference that can cause unwanted peaks.
- Monitor the signal in real time: Use data acquisition software that allows you to monitor the signal in real time and quickly identify any signs of saturation.
Vibration waveform analysis – importance of acquisition time in visualizing low-frequency events
Waveform acquisition time is a crucial parameter in vibration analysis, especially when seeking to identify low-frequency events. Choosing this time appropriately ensures accurate capture of signal characteristics and allows for a more detailed analysis of machine conditions..
Why acquisition time is so important?
- Spectral resolution: Acquisition time is directly related to spectral resolution. The longer the acquisition time, the greater the number of spectral lines and, consequently, greater frequency resolution. This allows you to identify closer frequency components, such as low frequency, which are often associated with problems such as misalignment, unbalance and defects in bearings.
- Low frequency event capture: Low frequency events have a long period, that is, occur less frequently over time. To capture a full cycle of these events, a sufficiently long acquisition time is required. A short acquisition time may result in insufficient sampling of the signal, leading to a loss of information and difficulty in identifying these events.
- Transient analysis: Transients are short-term events that may occur during machine operation. An adequate acquisition time allows capturing these transients and analyzing their nature, which can provide important information about the condition of the machine.
How to choose the appropriate acquisition time?
The choice of acquisition time depends on several factors, What:
- Fundamental frequency of the machine: The fundamental frequency of the machine, generally related to rotation frequency, determines the period of a complete cycle. The acquisition time must be an integer multiple of this period to ensure synchronization with the signal.
- Frequencies of interest: If the objective is to analyze low frequency components, as the natural frequencies of the structure, the acquisition time must be long enough to capture multiple cycles of these components.
- Sampling rate: The sampling rate determines the number of data points collected per unit of time. An adequate sampling rate is essential to avoid aliasing and ensure analysis accuracy.
- Storage capacity: Acquisition time is also limited by the storage capacity of the acquisition equipment.
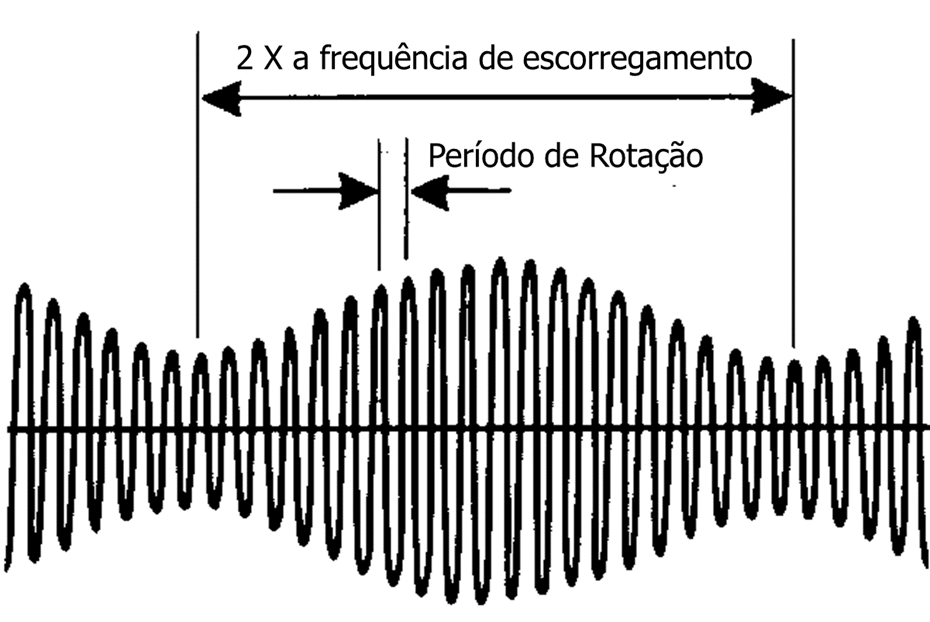
Vibration waveform analysis – beat
Bumping in a vibration waveform is a phenomenon that occurs when two waves with slightly different frequencies overlap. This overlap results in a resultant wave whose amplitude varies periodically over time., creating a characteristic pattern of “pulses” or “beats”.
Causes of Beating:
- Nearby frequencies: The beat is more evident when the two frequencies are close to each other.
- Multiple vibration sources: Machines with multiple vibration sources may generate slightly different frequencies, causing heartbeat.
- Modulation: A vibration signal can be modulated by another signal of lower frequency, resulting in a beat.
How to identify a beat:
- Time domain analysis: The waveform will present a periodic variation in amplitude, with alternating peaks and valleys.
- Frequency domain analysis: The frequency spectrum will show two closely spaced spectral lines, representing the two frequencies that are causing the beat.
Beat Frequency:
The beat frequency (fb) is due to the difference between the two frequencies that are causing the phenomenon:
fb = |f1 – f2|
Where:
- fb: beat frequency
- f1 e f2: frequencies of the two waves that are overlapping
Vibration waveform analysis – modulation
Modulation in a vibration waveform refers to a systematic variation in amplitude, frequency or phase of a carrier wave, due to the influence of a modulating signal. In other words, the characteristics of the main wave (carrier) are changed by a secondary signal (modulator).
Why modulation occurs in machine vibrations?
Modulation in machine vibrations is often caused by interactions between different machine components or by varying operating conditions.. Some common causes include:
- Bearing problems: Bearing defects can generate lateral frequency components that modulate fundamental vibration.
- Load variations: Changes in the load applied to the machine can cause variations in the amplitude and frequency of vibration.
- Interactions between components: The interaction between different vibratory components can generate modulation.
Types of Modulation:
- Amplitude modulation (AM): The amplitude of the carrier wave varies according to the modulating signal.
- Frequency Modulation (FM): The frequency of the carrier wave varies according to the modulating signal.
- Phase Modulation (PM): The phase of the carrier wave varies according to the modulating signal.
How to identify modulation:
- Time domain analysis: The waveform will present a periodic variation in amplitude, frequency or phase.
- Frequency domain analysis: The frequency spectrum will show sidebands around the carrier frequency, indicating the presence of modulation.
- Phase analysis: Wave phase analysis can reveal information about the nature of modulation.
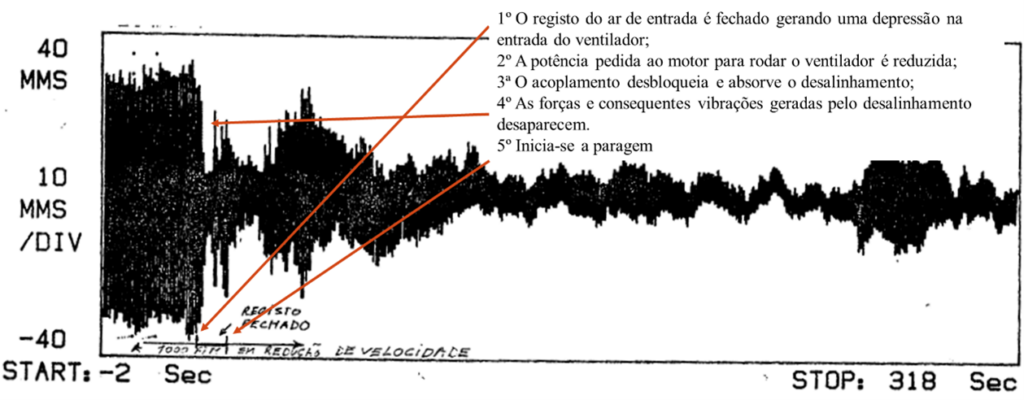
Vibration waveform analysis – electrical and mechanical problems
In the waveform, the evolution of electrical and mechanical problems during a motor stop is different.
To learn more about fault diagnosis using vibration analysis click here.