Vibration analyzer – the shape of the spectrum
Vibration analyzer – the shape of the spectrum
In this article on “Vibration analyzer – The shape of the spectrum” explains why high frequencies can be better seen in acceleration spectra, relative to what is seen in the spectra of the same signal, in speed or displacement.
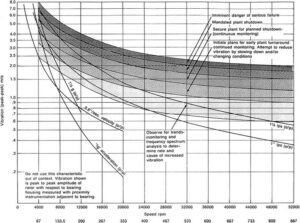
When it takes place Vibration Analysis in machines, in a vibration analyzer when performing predictive maintenance, common vibration analyzer This article presents the vibration limits in rotary-dynamic pumps as defined in the ISO series of standards..
Vibration Analyzer – Acceleration – Velocity – displacement
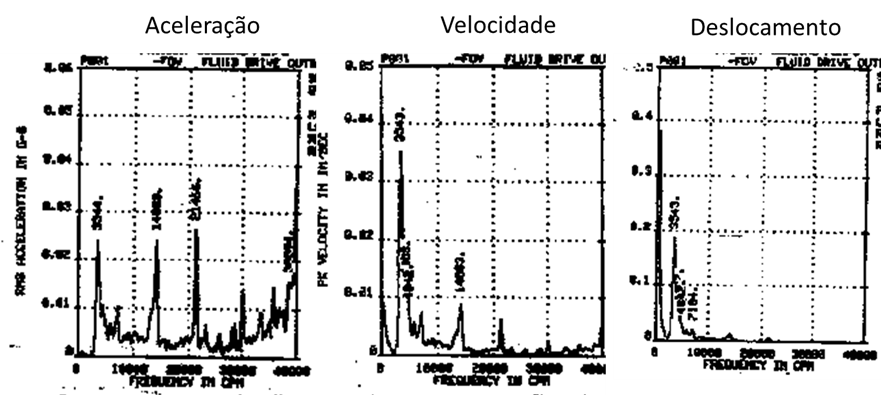
It is known that in order to observe the vibrations that occur in the right part of the spectrum, at the highest frequencies, it is better to use the acceleration parameter.
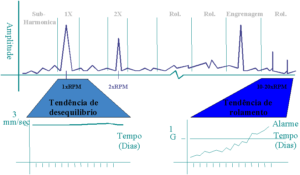
De facto, in the spectra of the figure, obtained in the same measurement point, it can be seen that, effectively remove vibrations at high frequencies, if you can see better, especially in acceleration.
The mathematical relationship between Acceleration, Speed and Displacement
The relationship between the magnitude of displacement of velocity and acceleration, in a sinusoidal vibration is:
d = offset
speed = w d
Acceleration = w2 d = w v
where w = 2pf
f- Frequency Hz
This is the mathematical description of the relationship of the amplitudes of the components of a spectrum, when it is displayed in Acceleration, Speed or Displacement.
However, machines and structures, don't know anything about math and, therefore, the answer to the question of why this is so, has not yet been given.
Vibration analyzer – The shape of the spectrum – the yield stress of materials
Yield stress or elastic limit stress, (or yield stress, No brazil), is the maximum stress that a material can withstand, still in the elastic regime of deformation. If there is any increase in stress, the material no longer follows Hooke's law and begins to undergo plastic deformation. (definitive deformation).
the next step, no component of a machine, can work with stresses higher than the yield stress of the materials, that constitute it, under penalty of suffering from definitive formations and being subject to no longer being used for the purpose of the project.
The tensile test graph for steel is well known, the objective of which, among others, consists of determining the yield stress.
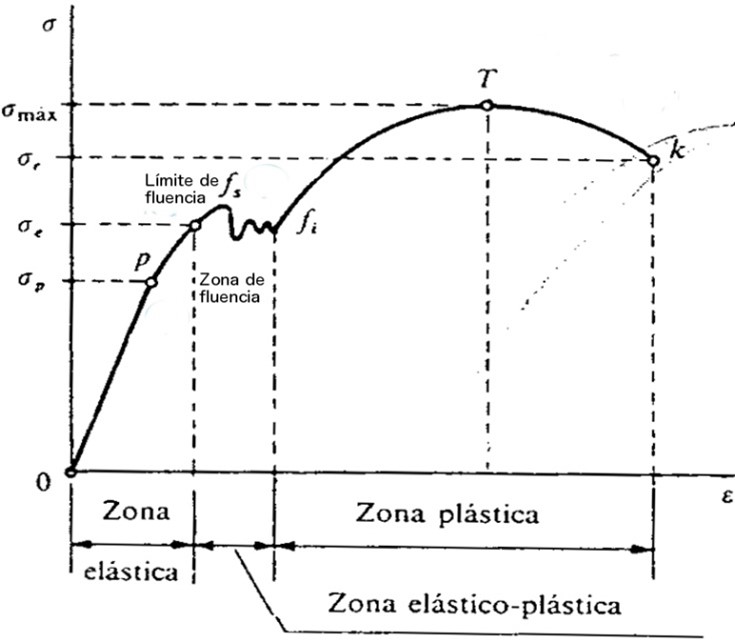
Thus, machine parts cannot be subjected to forces that cause yield stress to be exceeded in any of their parts..
The forces at play in the operation of machines
Take the example of a centrifugal water pump.
- In the motor, electrical energy is converted into mechanical energy.
- The shaft transmits mechanical energy.
- In the pump, mechanical energy is converted into electrical energy..
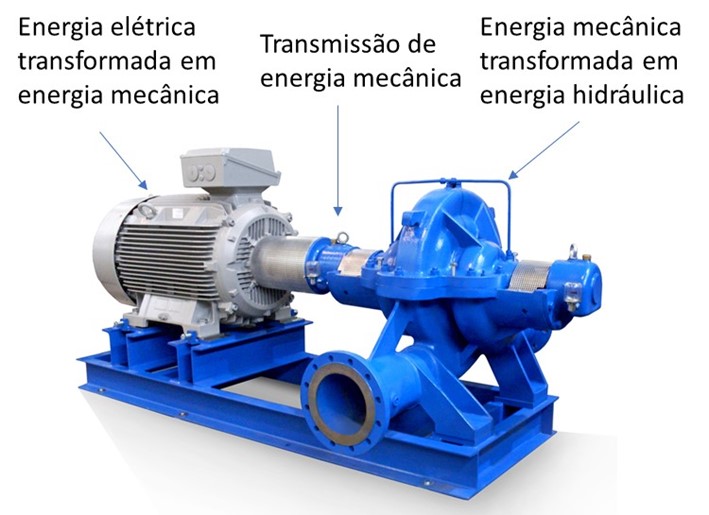
Because the pump is a rotating machine, all these forces are cyclic and generate vibrations..
When vibrations are generated, inertia comes into play., the viscosity and stiffness of the materials from which the various components of the pump are made.

Vibration analyzer – The shape of the spectrum – Forces caused by vibrations
It is known that the force generated by the inertia of materials is given by the following formula:
Force = mass x acceleration
Whatever the frequency of the vibration, this force cannot generate stresses greater than the yield stress of the materials. This fact can be represented as follows.
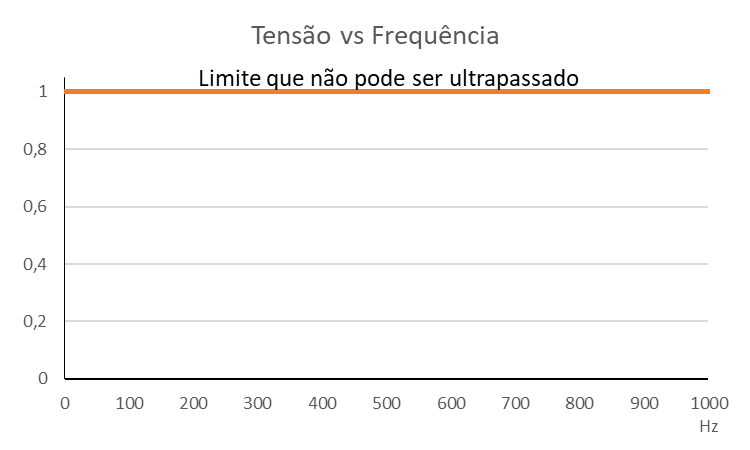
So we have that the force that applies to a component of a machine, due to its inertia, is proportional to the acceleration to which it is subjected.
we have, therefore, what, due to the force of inertia, there is a limit to the acceleration to which the organs of machines are subject, not to exceed the Yield Tension, whatever your frequency.
Vibration analyzer – The shape of the spectrum – The ratio between acceleration velocity and displacement
From the formulas of the relationship between acceleration, speed and displacement, for sinusoidal vibrations, you have to keep the acceleration value equal to one, on all frequencies, the values of velocity and displacement will have the evolution that can be seen in the following figure.
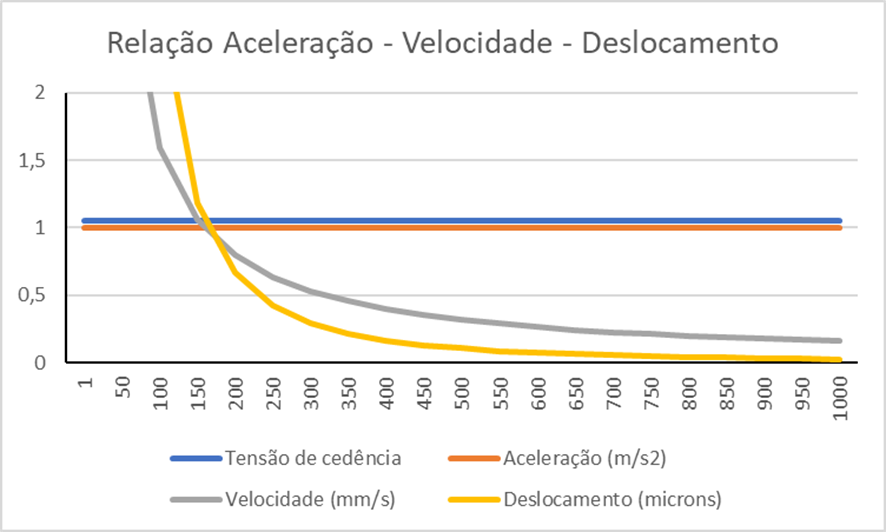
In this graph, the attenuation of the amplitudes of the spectrum components is obvious, in speed and displacement, as the frequency increases.
it is, therefore, explained, the physical reason for the high frequencies of the vibrations, look better in acceleration.
Case, at high frequencies, components of the vibration spectrum can be seen, in speed or displacement, it's best to run away..., the yield stress of the material of any of the organs was, probably, outdated …, something is going to break...

