The phase in a vibration analyzer
In this article we focus on phase measurement in a vibration analyzer.
Introduction – phase one vibration analyzer
The phase in a vibration analyzer, or more properly, the phase angle, consists of an angle between two quantities, which can be diverse.
The phase between displacement and velocity and acceleration
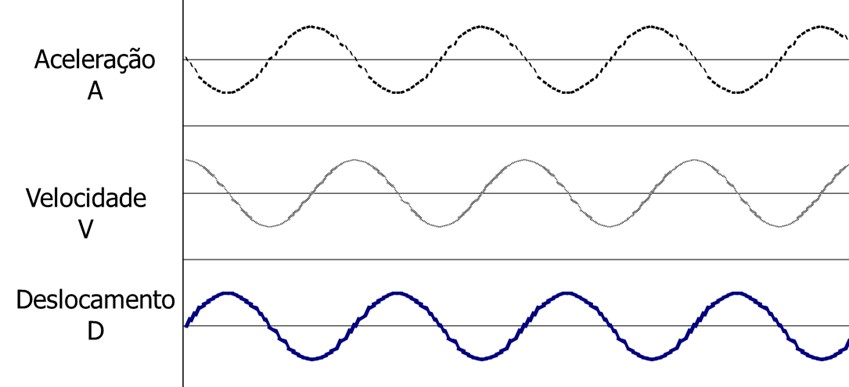
In a harmonic vibration there is a phase difference of 90° between the maximum of the vibration in acceleration and velocity., and the same difference between maximum speed and displacement. The phase difference between acceleration and displacement maximums is 180°.
The phase in a vibration analyzer – phase between maximum vibration and a tachometer boost
The phase can be measured with a strobe connected to a frequency spectrum analyzer or a system that gives a digital readout of its value.
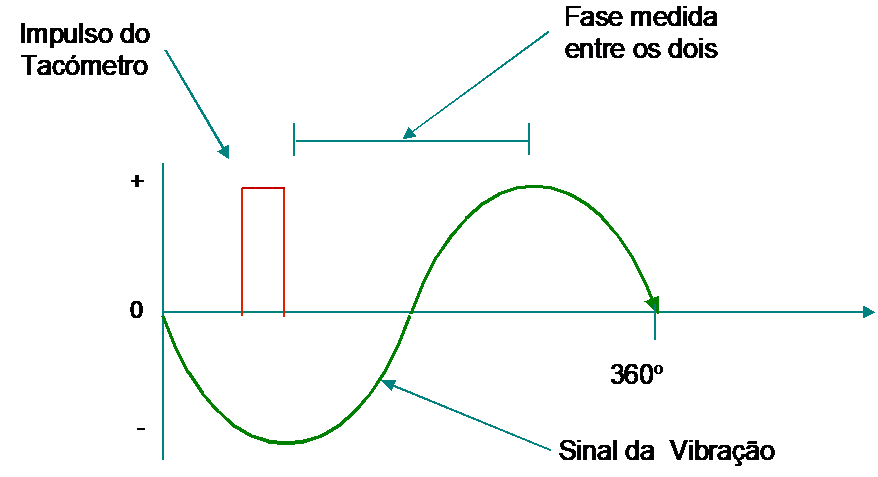
A mark on the rotor produces a signal once per revolution, sending a pulse to the phase meter.
Below you can see a video on this topic..
This phase measurement method is widely used to perform the equilibragem no local.
The phase in a vibration analyzer – the phase between two vibration measurements
In the following video, relating to phase measurements at two measuring points on a grinding machine, one can see the phase differences.
In this case, the maximum phase values of each vibration are measured., relative to a tachometer signal and compare the value between the two.
Phase measurement with a two-channel analyzer
The phase between a force and a vibratory movement – the FRF
The phase can also be measured between a force ( in this case the impact of the hammer) and a vibrating motion, as seen in the video below.
This type of measurement is used to measure the Frequency Response Function, what you see next.
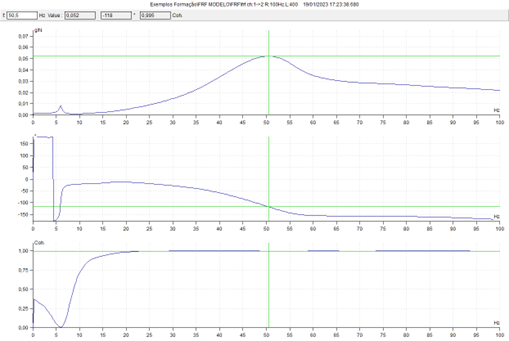
It is seen that the phase variation is maximum at the frequency corresponding to the natural frequency corresponding to the peak in the first graph.
The phase between a force and a vibratory movement – in a spring mass system
Below is a video that explains the phase relationship between the force and the displacement of an oscillation., in a mass-spring system, with one degree of freedom.
At very low frequencies, the mass-spring system behaves like a rigid body.. The displacement of force is equal to the displacement of mass. In this case, the inertial force generated by the mass is less than the force generated by the stiffness of the spring..
At frequencies higher than the natural frequency of the mass-spring set., the two motions are in phase opposition. The displacement of force is greater than the displacement of mass. In this case, the inertial force generated by the mass is greater than the force generated by the stiffness of the spring..
The phase variation during a machine stop – the Bode plot
Below you can see a video that shows the phase difference between the component and the rotational speed of a machine, caused by an imbalance, and a tachometer signal, during machine stop.
In this video it is seen that the phase value also depends on the frequency as in the Video 6.
This type of measurement can be used to obtain the Bode plot, which can be seen below.
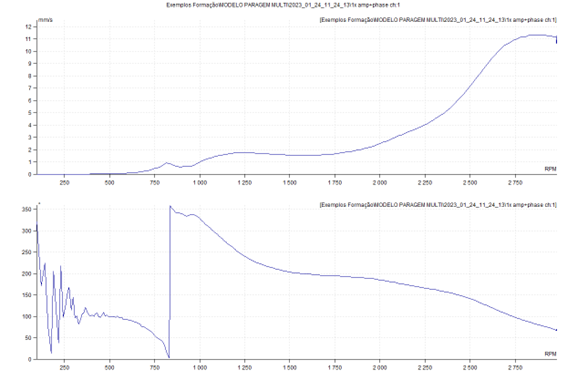
Thus it is seen that, on a machine, the phase value varies with the speed of rotation.
Below you can see a video on this topic..


